Fig. 6.
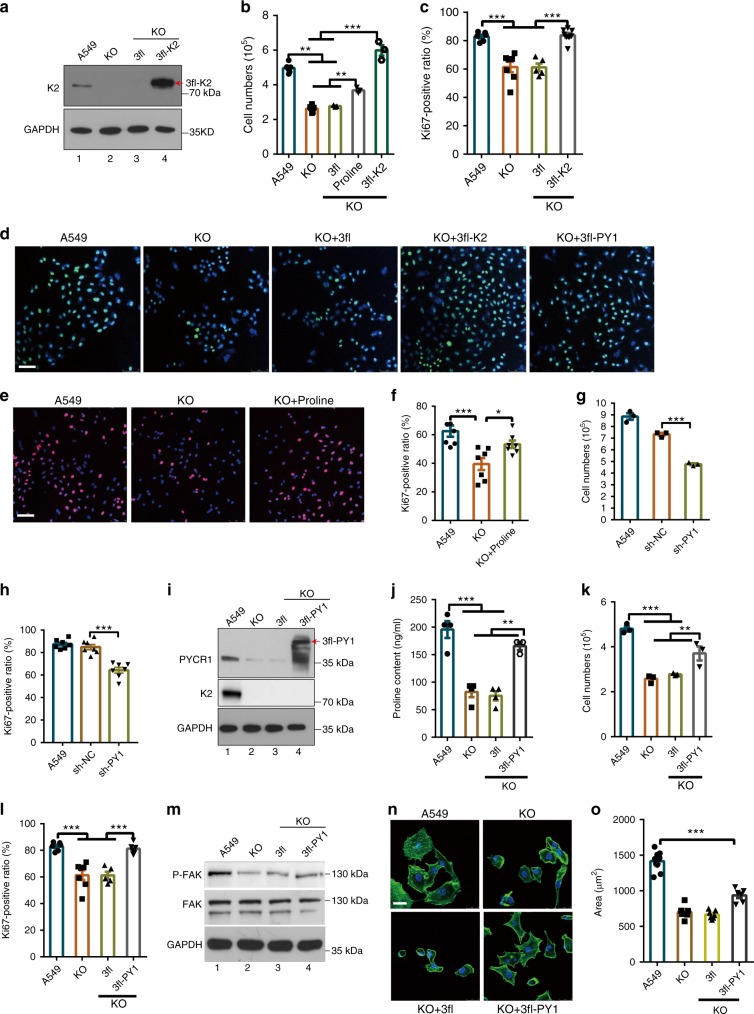
Kindlin-2 regulates cell proliferation through PYCR1. a–d Kindlin-2 KO A549 cells were infected with lentiviral vectors encoding 3xFLAG-tagged kindlin-2 (3fl-K2) or 3xFLAG empty vector (3fl). Three days later, the cells were analyzed by western blotting (a). The cells were seeded in six-well plate (1 × 10⁵/well), cultured for 2 days, and the number of cells was counted (b, n = 3). Cells were stained with DAPI and anti-Ki67 antibody (d). Scale bar, 75 μm. The percentages of Ki67-positive cells were quantified (c, n = 5). e, f Kindlin-2 KO A549 cells were treated with proline for 3 days (interval of treatment = 12 h). Cells were stained with DAPI and anti-Ki67 antibody (e). Scale bar, 75 μm. The percentages of Ki67-positive cells were quantified (f, n = 5). g, h A549 cells were infected with PYCR1 shRNA (Sh-PY1) or control (Sh-NC) lentivirus for 5 days. The cells were seeded in six-well plate (1×10⁵/well), cultured for 2 days, and the numbers of cells were counted (g, n = 3). Cells were stained with DAPI and anti-Ki67 antibody and the percentages of Ki67-positive cells were quantified (h, n = 5). i–l Kindlin-2 KO A549 cell lines (ko) were infected with lentiviral vectors encoding 3×FLAG tagged PYCR1 (3fl-PY1) or 3xFLAG empty vector (3fl). Three days later, the cells were analyzed by western blotting (i). The proline levels in KO, KO+3fl, and KO+3fl-PY1 cells were quantified and compared with that of A549 (j, n = 3). The cells were seeded in growth medium in six-well plate (1×10⁵/well), cultured for 2 days, and then the numbers of cells were counted (k, n = 3). Cells were stained with DAPI and anti-Ki67 antibody. The percentages of Ki67-positive cells were quantified (l, n = 5). m–o Kindlin-2 KO A549 cells were infected with lentiviral vectors encoding 3xFLAG-tagged PYCR1 (3fl-PY1) or 3xFLAG vector (3fl). Three days later, the cells were analyzed by western blotting (m). Cells were immunofluorescently stained with Alexa Fluor-conjugated phalloidin (n). Scale bar, 25 μm. Cell areas (o) were quantified using Image J. At least 50 cells from each group were analyzed (n = 5). Data in b, c, f, g, h, j–l, and o are presented as mean ± SEM using one-way ANOVA with Tukey–Kramer post-hoc analysis, *P < 0.05; **P < 0.01; ***p < 0.001

