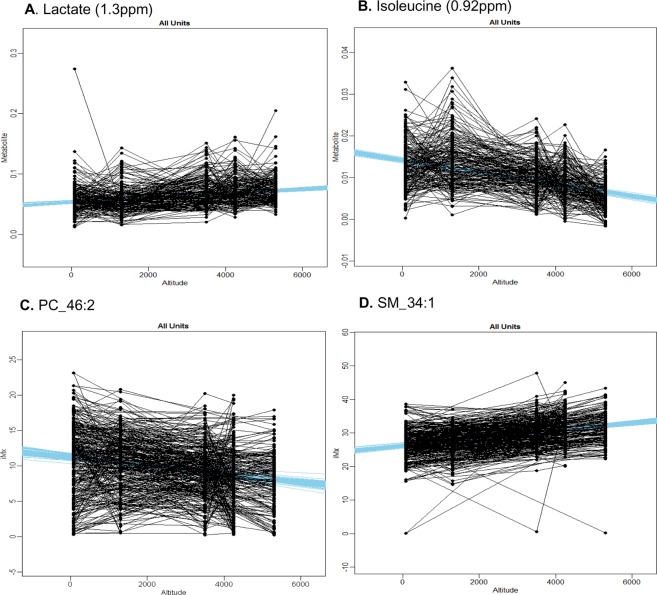
Figure 2.
An example of the full subject group response of aqueous metabolites or lipids that demonstrate a significant trend with increasing altitude, identified using Bayesian hierarchical modelling. Example plots of lactate (A) and isoleucine (B), with corresponding 1H-NMR regions, phosphocholine (PC) 46 carbons: 2 double bonds (46:2) (C) identified in negative ion mode and sphingomyelin (SM) 34:1 (D) identified in positive mode. Representative regression lines in blue have been drawn from the fitted distribution. This group distribution (all units) was informed from the most likely distribution at the level of the individual. Y axes metabolite units are arbitrary units, derived from the spectral intensity changing per km altitude.

