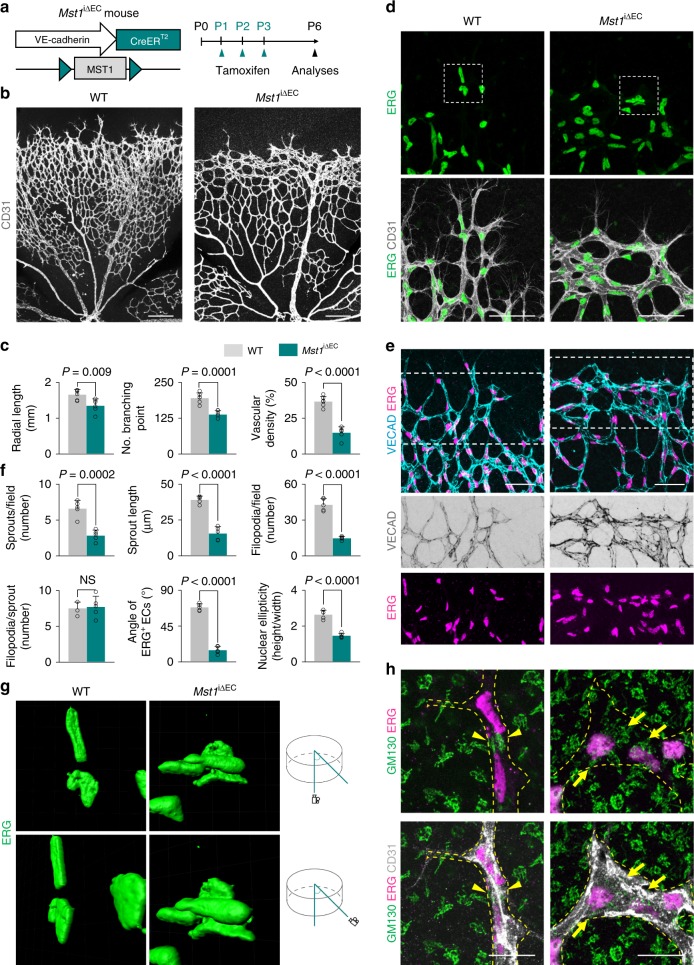
Fig. 1.
MST1 plays a critical role in establishing endothelial polarization. a Diagram depicting the experimental schedule for endothelial cell (EC)-specific deletion of MST1 in retinal vessels from P1 and their analyses at P6 using Mst1i∆EC mice. b, c Images of CD31+ retinal vessels and comparisons of indicated parameters in WT (n = 6) and Mst1i∆EC (n = 6) mice. Scale bars, 200 μm. d Magnified images of CD31+ vessels and ERG+ nuclei of ECs in WT and Mst1i∆EC mice. The insets (white dashed-line boxes) are 3D reconstructed and magnified in g. Scale bars, 50 μm. e Images showing abnormally aligned VE-cadherin (VECAD) and ERG+ nuclei of ECs in the vascular front of Mst1i∆EC mice compared with those of WT mice. Middle and bottom panels show VECAD and ERG signals of insets (white dashed-line boxes) in top panels. Scale bars, 100 μm. f Comparisons of indicated parameters in WT (n = 5) and Mst1i∆EC (n = 5) mice. g 3D reconstructed images of ERG+ nuclei of ECs from the front and a 45° angle showing that the ERG+ nuclei of ECs overlap each other in Mst1i∆EC mice. h Images of CD31+ vessels, ERG+ nuclei of ECs, and GM130+ Golgi apparatus at tip ECs of WT and Mst1i∆EC mice. The yellow dashed line outlines CD31+ vessels. Note that GM130+ Golgi apparatus are polarized towards the anterior or posterior of the nuclei in tip ECs of WT mice (yellow arrowheads), while such polarization is lost in tip ECs of Mst1i∆EC mice (yellow arrows). Scale bars, 20 μm. Data represent mean (bar) ± s.d. (error bars). P values, versus WT by two-tailed unpaired t-test. NS not significant. Source data are provided as a Source Data file

