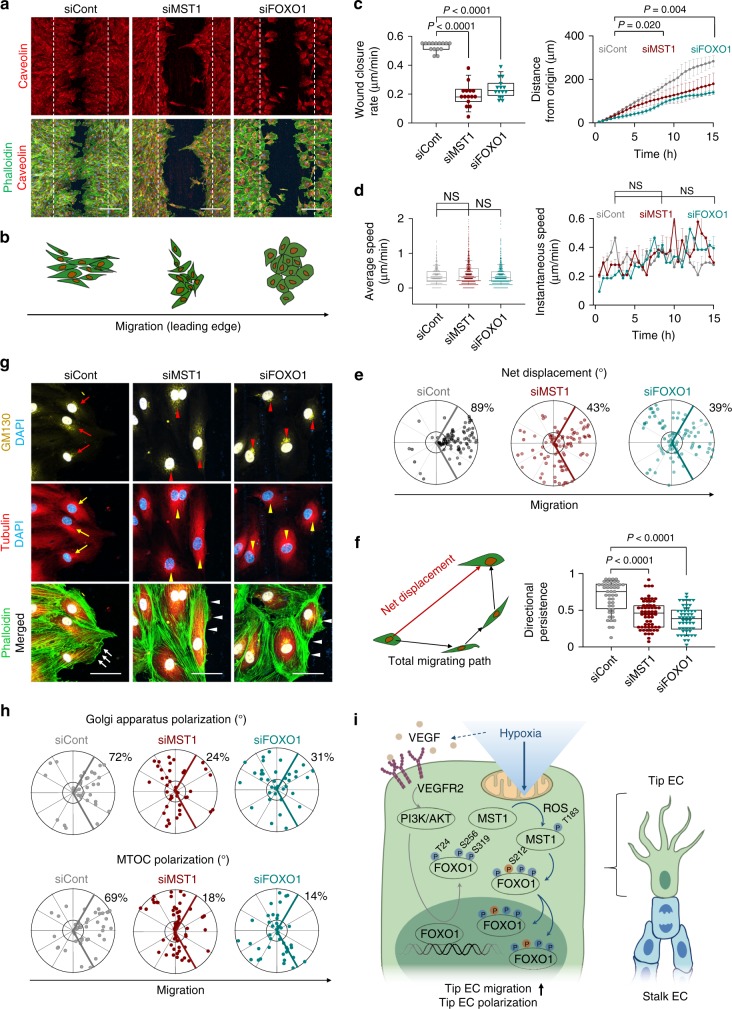
Fig. 7.
MST1–FOXO1 cascade establishes cell polarity in EC migration. a Images of phalloidin+ actin cytoskeleton and caveolin in indicated ECs subjected to the wound scratch. The dashed lines indicate the initial margin of wound scratch. Scale bars, 200 μm. b Schematic pictures depicting cell morphology at the leading edge in indicated ECs. c Comparisons of indicated parameters in indicated ECs. n = 15, each group in the left panel. n = 10–15, each group at each time in the right panel. d Comparisons of indicated parameters in indicated ECs. n = 1941(siCont), 2190(siMST1), 2217(siFOXO1) in the left panel. n = 24–25, each group in the right panel. e Polar plots showing net displacement. n = 94(siCont), 98(siMST1), 88(siFOXO1). f Schematic picture depicting net displacement and total migrating path and comparison of single cell directional persistence defined by net displacement divided by total migrating path length in indicated ECs. n = 47(siCont), 61(siMST1), 52(siFOXO1). g Images of phalloidin+ actin cytoskeleton, α-tubulin+ microtubule, GM130+ Golgi apparatus and DAPI in the leading edge of indicated ECs at 9 h after initiating cell migration. Note that Golgi apparatus and microtubule (red and yellow arrows) in siCont-ECs are localized in the direction of cell migration, while those (red and yellow arrowheads) in siMST1-ECs and siFOXO1-ECs are localized randomly. Moreover, siMST1-ECs and siFOXO1-ECs rarely show lamellipodia (white arrowheads) compared to siCont-ECs (white arrows). Scale bars, 50 μm. h Polar plots showing Golgi apparatus [n = 36(siCont), 41(siMST1), 38(siFOXO1)] and microtubule organizing centre (MTOC) polarization [n = 45(siCont), 57(siMST1), 41(siFOXO1)]. i Schematic picture summarizing predominant role of MST1 in the nuclear import of FOXO1 against VEGF/VEGFR2-PI3K/AKT pathway at tip ECs. c, d, f Box plots represent Center line, median; Box limits, upper and lower quartiles; whiskers, s.d. Right panel in c represents mean (points) ± s.d. (error bars). Right panel in d represents Bar, mean; Points, median. P values, versus siCont by one-way ANOVA with Tukey’s post hoc test. NS not significant. e, h the bold lines indicate 120° region centered on the vector which is vertical to the wound scratch direction. The numbers indicate the frequency of dots within the 120° region of the bold line. Source data are provided as a Source Data file

