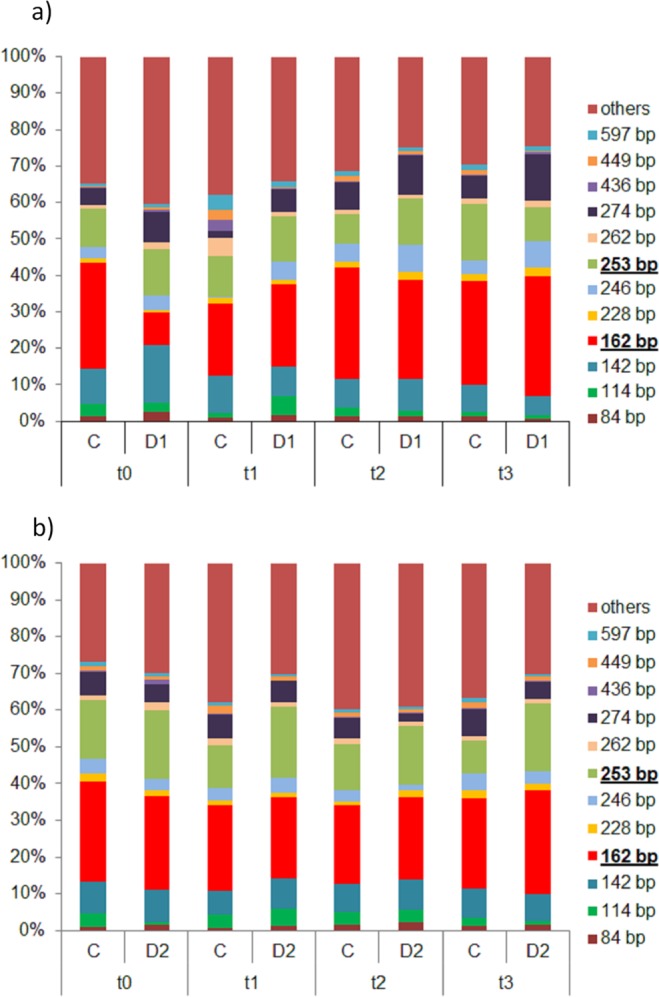
Figure 2.

Relative abundance of the TRFs of the amoA AOA gene in percent [%] for (a) spring drought event (D1 and C) and (b) summer drought event (D2 and C). TRFs smaller than 3% are combined as “others”. Sampling took place on the last day of the drought (t0) and one (t1), two (t2) and four (t3) weeks after rewetting for D1 and D2, respectively. Most dominant peaks (162 and 253) are marked in the legend with bold and underlined letters.
