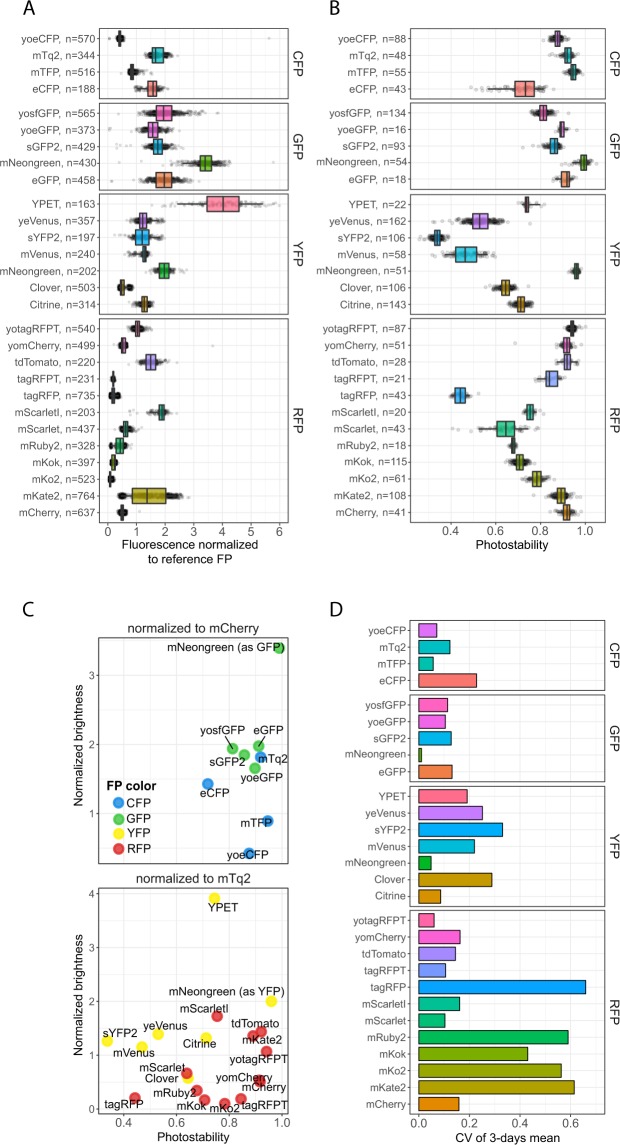
Figure 2.
In vivo brightness and photostability of FPs. (A) In vivo brightness of FPs measured by dividing the fluorescence intensity of the FP of interest by the fluorescence of the control FP (either mTq2 or mCherry). (B) Photostability of FPs. Per FP, a time-lapse movie was recorded and the photostability was measured as the fluorescent fraction of the last time frame compared to the first frame. Dots represent relative brightness or photostability of an individual cell, boxes indicate median with quartiles, whiskers indicate the 0.05–0.95 fraction of the datapoints. (C) Overview of the brightness and photostability of all characterised FPs. (D) Coefficient of variation (CV) of the mean brightness of 3 days as an indication of day-to-day variation.

