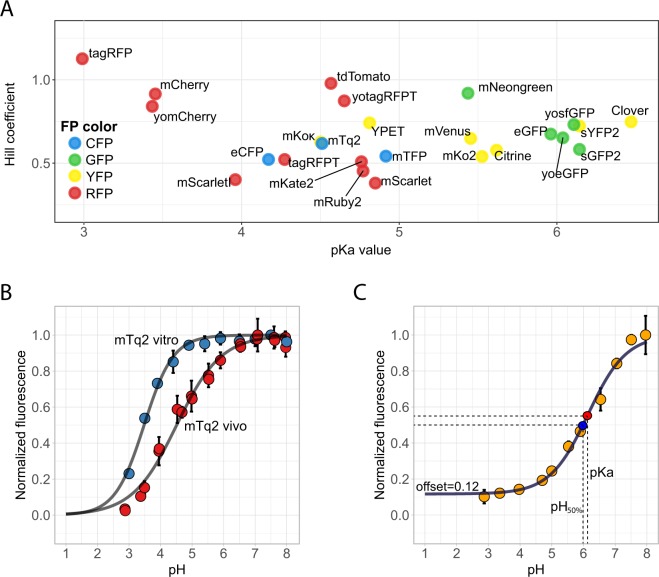
Figure 4.
pH sensitivity of FPs. (A) Yeast cells were incubated for 2 hours in citric-acid/Na2HPO4 buffers set at pH 3–8 with 2 mM 2,4-DNP and fluorescence was measured using a fluorescent plate reader. Per FP, at least 3 technical replicates were measured. Afterwards, fluorescence was normalized to the pH giving the highest fluorescence and a Hillfit was performed to determine the Hill coefficient and pKa value, plotted at the y- and x-axis, respectively. (B) mTq2 is an example of an FP that shows different pH sensitivity. pH calibration in vitro was performed using purified proteins in a Citric Acid – Sodium Citrate buffer (pH 3–5.4) and a NaH2PO4/Na2HPO4 0.1 M buffer (pH 5.9–8). Dots represent the mean of at least 3 replicates, error bars indicate SD. (C) pH curve of sYFP2 which shows an offset (fluorescence plateau) at low pH. This offset gives different values of the pKa (red point, which is the pH that gives a 50% decrease between 1 and the offset) and the pH50% which gives an absolute 50% decrease in fluorescence (blue point). Dots represent mean of at least 3 replicates, error bars indicate SD.

