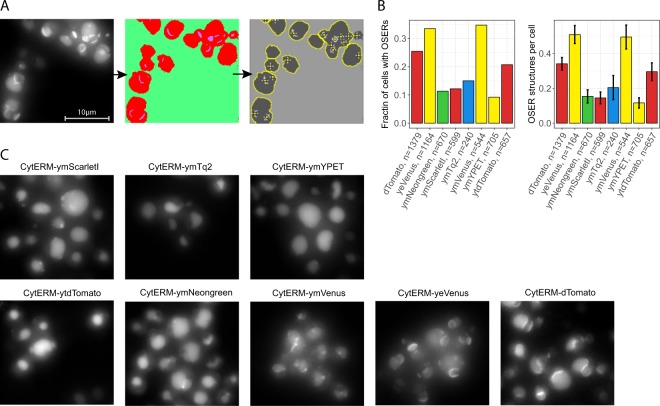
Figure 7.
Monomerism of the yFPs. Cells expressing Cyterm-(y)FP were grown overnight at 30 °C and incubated for at least 1 hour at room temperature before microscope visualization. (A) Example of cells showing OSER structures and the pipeline to count OSER structures. (B) Monomerism of various FPs depicted by the fraction of cells with an OSER structure (left graph) and amount of OSER structures per cell (right graph). Error bars indicate 95CI. (C) Examples of the OSER assays per FP (max intensity projection of the Z-stack is shown).

