Figure 3.
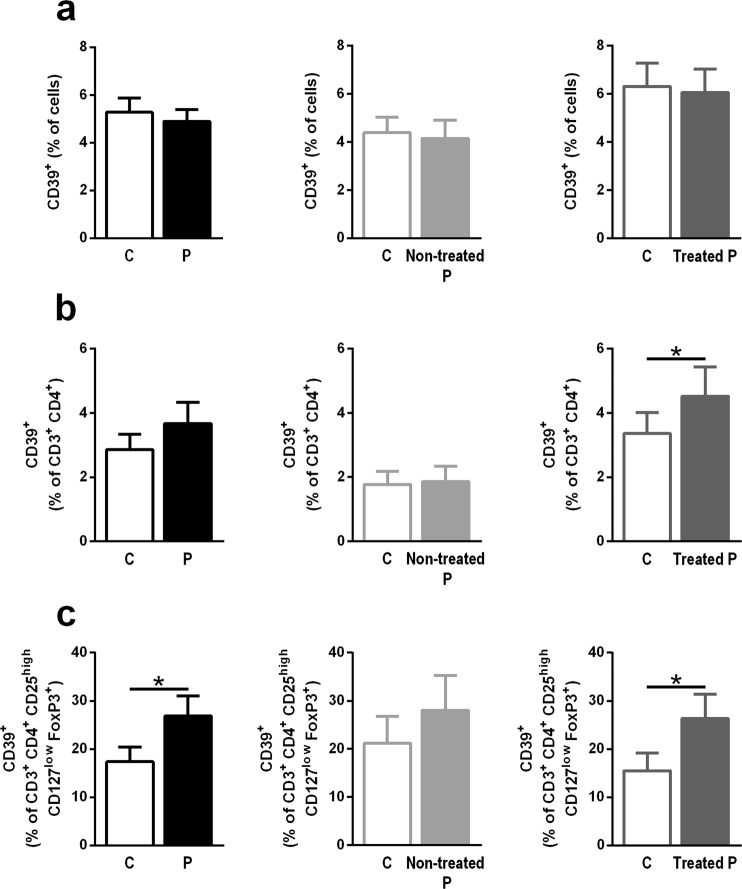
Increased frequency of peripheral CD39-expressing Tregs in relapsing-remitting MS patients (P) compared with controls (C). (a) Frequency of CD39+ total cells in all patients and controls (n = 46) (left; black); untreated patients and their controls (n = 15) (middle; light grey); and treated patients and their controls (n = 31) (right; dark grey). (b) Frequency of CD39-expressing CD3+ CD4+ T cells in all patients and controls (n = 46) (left; black); non-treated patients and their controls (n = 15) (middle; light grey); and treated patients and their controls (n = 31) (right; dark grey). (c) Frequency of CD39+ CD3+ CD4+ CD25high CD127low FoxP3+ Treg cells in all patients and controls (n = 46) (left; black); untreated patients and their paired controls (n = 15) (middle; light grey); and treated patients and their controls (n = 31) (right; dark grey). Data represent the means ± SEM. *p ≤ 0.05.

