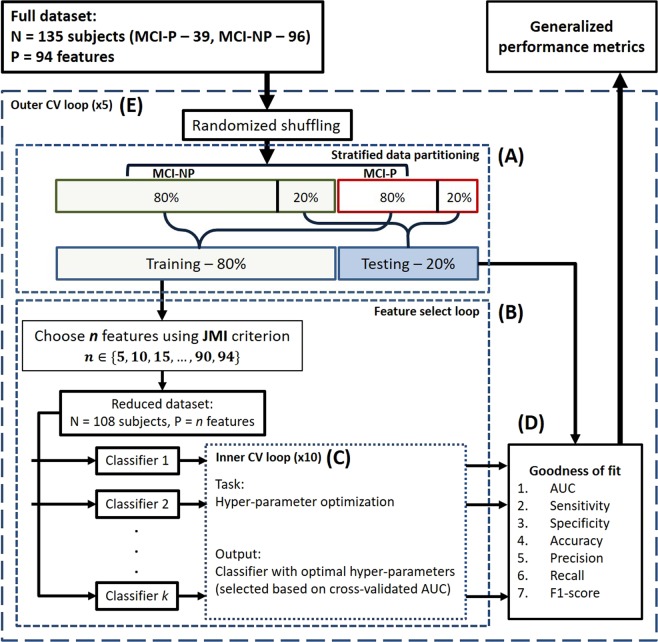
Figure 2.
A flow diagram illustrating the prediction framework. The framework uses a machine learning-based approach to learn a classifier using 80% of the full dataset and to test its performance on the remaining 20% of the data. Specific details of each step in the framework are as follows. (A) Stratified data partitioning: After the order of the subjects is randomized, the MCI-NP and MCI-P groups are separately partitioned with an 80%-training/20%-testing split. The respective training and testing sets from MCI-NP and MCI-P groups are combined to form the overall training and testing data for a single cross-validation. (B) Feature select loop: The top n out of 94 features that best jointly correlate with the class labels (P-MCI or MCI-NP) are selected using the joint mutual information (JMI) criterion. (C) Inner CV loop: A combination of hyper-parameters is selected for each classifier based on a tenfold cross-validation. (D) Goodness-of-fit metrics: The classifier learned in the previous step is tested on the testing dataset and measured on its performance. (E) Outer CV loop: A fivefold cross-validation is utilized to produce generalized performance metrics accounting for non-uniformly distributed data.

