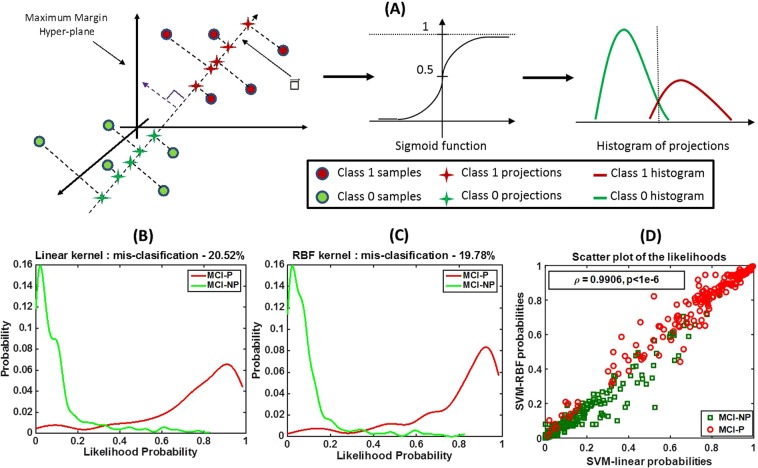
Figure 3.
An illustration of the method that evaluates linear separability of the data. We utilize a slightly modified version of the histogram of projections method to evaluate linear separability of the data. (A) A maximum margin hyperplane is learned using SVM with a choice of kernel. All samples are projected onto the line perpendicular to the hyperplane to obtain the projections. The projection lengths are transformed to a probability value via the sigmoid function. Histograms of the probabilities for the two classes are plotted separately. (B) Histograms of the probabilities of the MCI-P and MCI-NP samples in our dataset obtained using a linear kernel. (C) Histograms of the probabilities of the MCI-P and MCI-NP samples in our dataset obtained using an RBF kernel. (D) A grouped scatter plot of the probabilities obtained using linear and RBF kernels for MCI-P and MCI-NP classes. The similar histogram shapes and similar misclassification errors in (B,C), and the high correlation ( = 0.99, p < 1e-6) between the probabilities obtained using the two kernels, indicate that linear and nonlinear kernels result in similar boundaries for classification; hence, this dataset is linearly separable.

