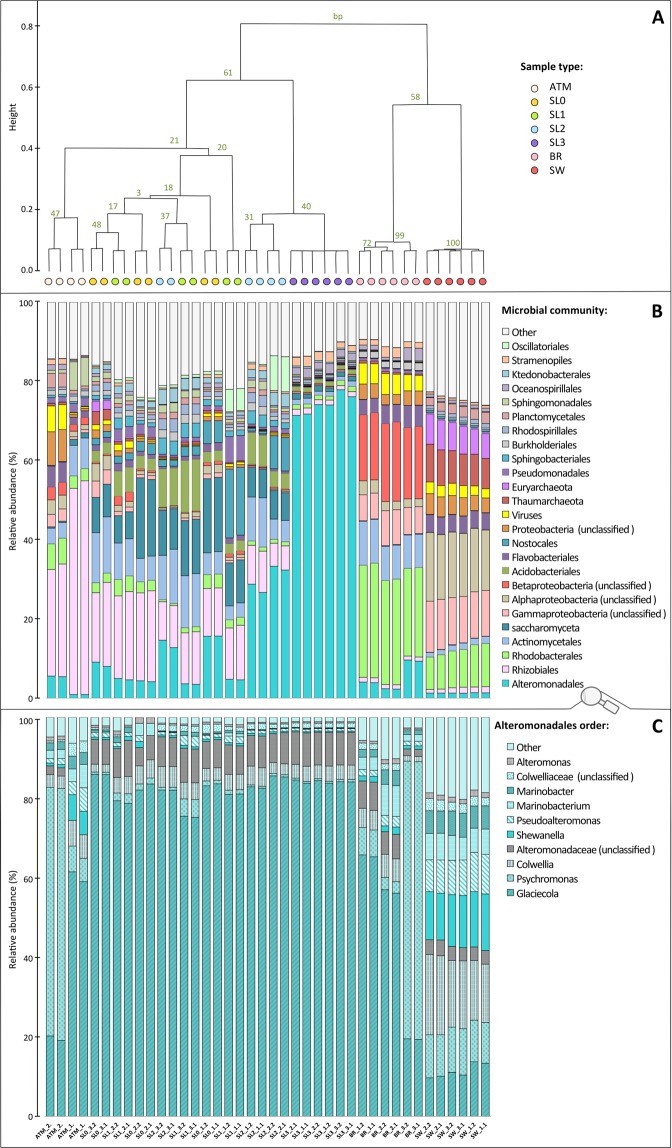
Figure 2.
Taxonomic composition. (A) Hierarchical cluster using average clustering method and correlation as distance measure and 1000 bootstrap resampling based on relative abundance of all taxa detected. Bootstrap probability (BP) values in percentage are indicated in green. Distance between clusters is indicated by height bar. Graph B and C are organized following the distribution of samples in cluster (colored circles) (B) Barplot of relative abundance of 25 most abundant taxa (class or order level, organized by mean decreasing order of abundance from the bottom to the top). (C) Barplot of relative abundance of most abundant genus within the Alteromonadales order (organized by mean decreasing order of abundance from the bottom to the top).

