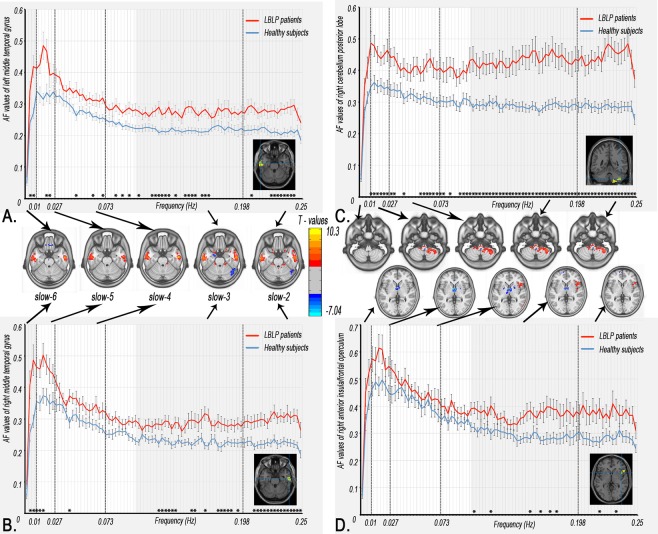
Figure 2.
Dynamic changes in the AF in the regions with prominent alterations in five specific frequency bands. The curves indicate the trend in the AF across the full-frequency band (0–0.25 Hz). Note: The red and indigo-blue lines represent LBLP and HC, respectively. The stars at the bottom of the graph represent statistical significance (Bonferroni-corrected α level of P < 0.05/84). The full-frequency band (0–0.25 Hz) was divided into 84 narrow band bins (0.003 Hz/bins), and the bright regions represent the conventional frequency band (0.01–0.10 Hz). The brain maps in the middle row show group differences in amplitude between the two groups in the five specific frequency bands (same as Fig. 3).

