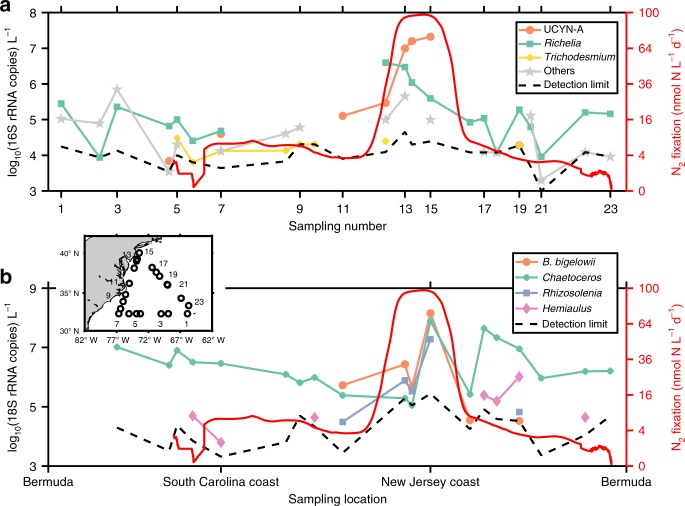
Fig. 2.
Absolute rRNA gene abundances of various diazotrophs and their potential hosts in surface seawater collected during the 2015 cruise. The inset map shows the locations where molecular samples were collected. The distributions of diazotrophs (a) and hosts (b) are compared with surface daily N2 fixation rates (solid red line). Diazotrophs and hosts below detection limits at different sampling locations are not shown in the figure. “Others” in panel a includes diazotrophic proteobacteria belonging to Bradyrhizobium, Mesorhizobium, Novosphingbium, and Paenibacillus

