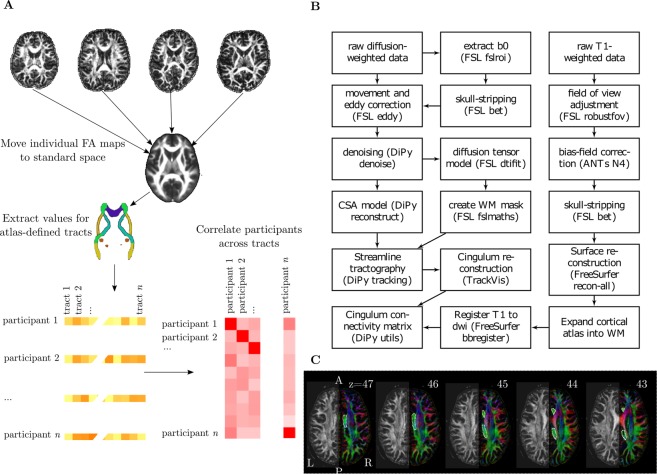
Figure 2.
(A) Illustration of processing steps to obtain estimates of similarity between individuals across major white matter tracts. (B) Overview of processing steps to derive structural connectivity of the cingulum. (C) Illustration of the ROI used for tractography of the cingulum. The ROI is marked with a dotted line on consecutive FA maps coloured according to the direction of diffusion. The left side of each figure shows the FA values.

