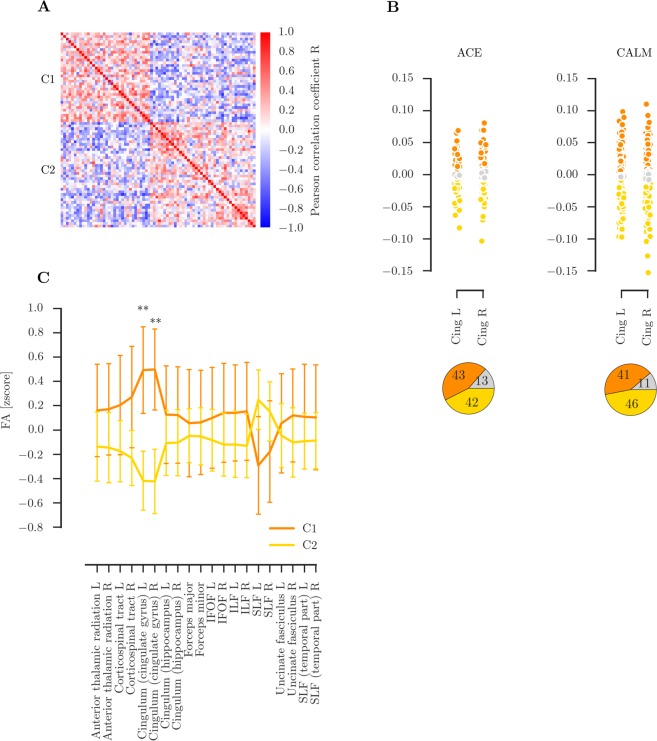
Figure 3.
Overview of clustering based on fractional anisotropy (FA) in major white matter tracts in the NKI sample. (A) Correlation within groups defined through community-based clustering of FA values in the NKI sample showing two distinct groups with high correlation within the cluster. (B) FA values in the left and right anterior cingulum in the ACE and CALM with grouping according to the ranges identified in the NKI sample clusters. The bottom figure show the percentage of participants in each cluster range with orange for C1, yellow for C2, and grey for participants that fell outside of both ranges. (C) Differences in FA for each major white matter tract between the clusters identified through community clustering. The error bars show one standard error, the middle of the bar indicates the median. Significant differences between clusters were found for the left and right anterior Cingulum. Abbreviations: IFOF: inferior fronto-occipital fasciculus, ILF: inferior longitudinal fasciculus, SLF: superior longitudinal fasciculus.

