Fig. 1.
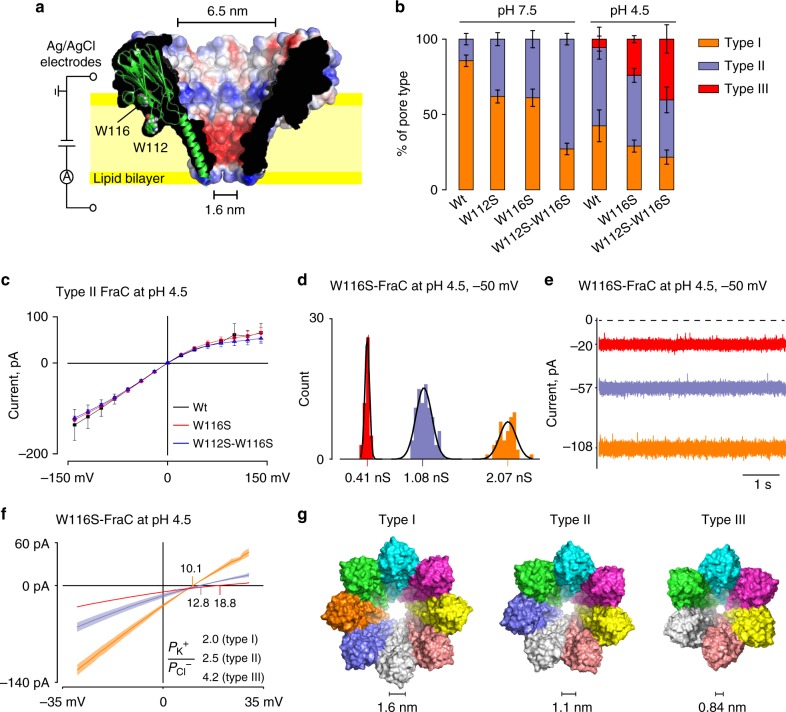
Preparation and characterization of type I, type II, and type III fragaceatoxin C (FraC) nanopores. a Cut through of a surface representation of wild-type FraC (Wt-FraC) oligomer (PDB: 4TSY33) colored according to the vacuum electrostatic potential as calculated by PyMOL. One protomer is shown as a carton presentation with tryptophans 112 and 116 displayed as spheres. b Percentage of the distribution of type I, type II, and type III for Wt-FraC, W112S-FraC, W116S-FraC, and W112S-W116S-FraC at pH 7.5 and 4.5. c IV curves of type II nanopores formed by Wt-FraC, W116S-FraC, and W112S-W116S-FraC at pH 4.5. d Single nanopore conductance of W116S-FraC in 1 M KCl at pH 4.5 and –50 mV. e Typical current traces for the three nanopore types of W116S-FraC in 1 M KCl at pH 4.5 under –50 mV applied potential. f Reversal potentials measured under asymmetric condition of KCl (1960 mM cis, 467 mM trans) at pH 4.5 for the three W116S-FraC nanopore types. The ion selectivity was calculated using the Goldman–Hodgkin–Katz equation (Eq. 1)52. g Molecular models of the three type FraC nanopores constructed from the FraC crystals structure using the symmetrical docking function of Rosetta. The diameters were measured from the distance between opposite side chains of D10 and include the van der Waals radii of the atoms. The electrophysiology recordings were performed with a 10 kHz sampling and a 2 kHz Bessel filter. The error bars and color shadow in the I–V curves are standard deviations from at least three repeats

