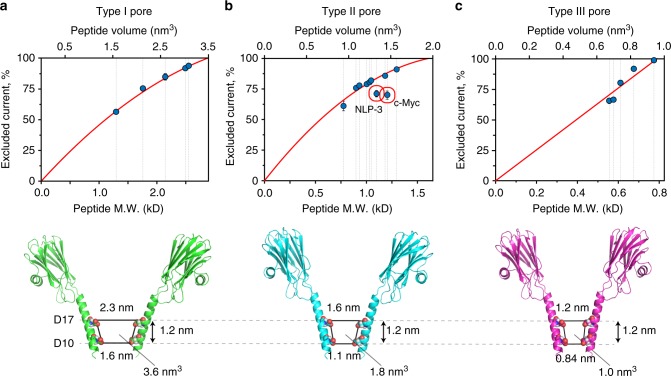
Fig. 4.
Recognition of peptides with different chemical composition at pH 4.5. On the top graph is the relation between the molecular weight (M.W.) or volume of the peptide and the Iex%. The bottom figure shows the sensing volume of type I wild-type fragaceatoxin C (Wt-FraC) (a), type II W116S-FraC (b), and type III W112S-W116S-FraC (c) nanopores. The solid line represents a second order polynomial fitting in a, b and a linear fitting in c, with the extrapolated value at 100% Iex% corresponding to the volume of a peptide that would completely occupy the sensing volume of the nanopore. The latter is most likely constricted to the volume included between the constriction of the pore (aspartic acid 10) and the residues that lie one turn of a helix above the constriction (aspartic acid 17). The distances are measured from two opposing residues and include the van der Waals radii of the atoms. Current blockades were measured at −30 mV for type I and II pore, and at −50 mV for type III pore in 1 M KCl solutions. The error bars represent standard deviation from at least three repeats. Red circles highlight the two peptides that bare a negative charge at pH 4.5 (Table 1)

