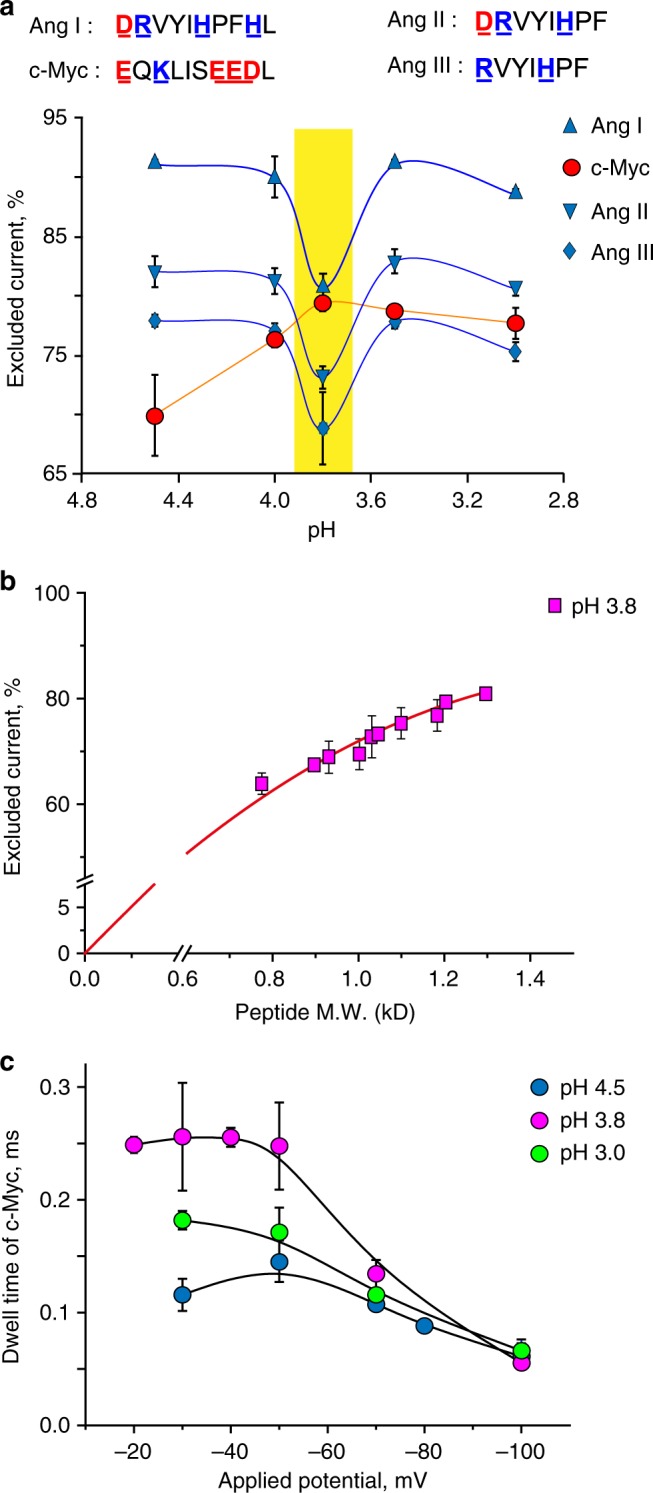
Fig. 5.

A nanopore peptide mass identifier. a Top, sequence of the four peptides tested. The amino acids that have a positive charge are in blue and the acidic residues in red. Below, pH dependence of the Iex% for the four peptides (cis) using type II W116S-fragaceatoxin C (FraC) nanopores under –30 mV applied potential. b Relationship between the Iex% and the mass of peptides at pH 3.8. c Voltage dependence of c-Myc dwell times at different pHs. All electrophysiology measurements were carried out in 1 M KCl, 0.1 M citric acid. The charges of the peptides were calculated according to the pKa for individual amino acids53. Standard deviations were calculated from at least three independent repeats
