Fig. 1.
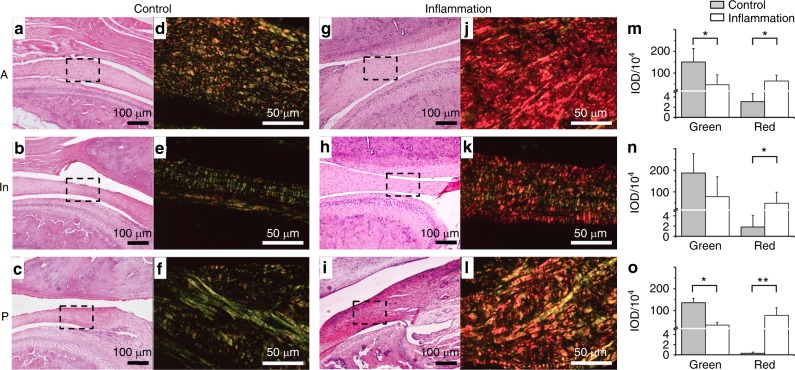
Histopathologic changes of TMJ discs. a–c Representative microscopic features of the discs from the control group subject to HE staining. The disc was thinner in the intermediate zone and thicker in the anterior and posterior bands. d–f Representative images of the disc from the control group assessed by picrosirius staining under polarized light. Collagen bundles presented yellowish to green reflection, and distribution of different colours was organized. The black dotted squares in a–c are magnified in d–f, respectively. g–i Representative microscopic features of the discs from the inflamed group subject to HE staining. The disc was thickened in all three regions. j–l Representative image of the disc from the inflamed group assessed by picrosirius staining under polarized light. Collagen bundles exhibited varied colours, but yellow to pink dominated. The distribution of different colours was disordered. The black dotted squares in g–i are magnified in j–l, respectively. m–o Inflammation decreased green intensity and increased red intensity in anterior and posterior bands significantly and exhibited the same tendency noted in the intermediated zone without significant differences. Y-axis represents IOD (integrated optimal density of positive pixel area). A, anterior band; In, intermediate zone; P, posterior band. *P < 0.05, **P < 0.01

