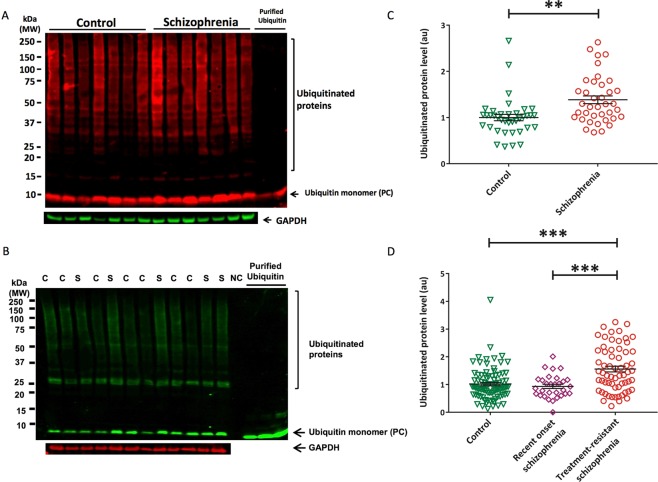
Figure 1.
Elevated ubiquitinated proteins in erythrocytes and orbitofrontal cortex among those with schizophrenia. Example Western blots showing the quantified bands from 15–250 kD, indicating ubiquitinated proteins in orbitofrontal cortex (A) and erythrocytes (B). S, schizophrenia; C, control. All samples were normalized to the internal control (purified ubiquitin) to account for gel-to-gel variability. Ubiquitinated protein levels normalized to GAPDH in orbitofrontal cortex among those with schizophrenia (mean = 1.31, se = 0.08) and controls (mean = 0.94, se = 0.08) (C) as well as erythrocytes from those with treatment-resistant schizophrenia (mean = 1.48, standard error [se] = 0.09), recent onset schizophrenia (mean = 0.93, se = 0.12), and healthy controls (mean = 0.95, se = 0.07) (D). **p < 0.01, ***p < 0.001, NC = negative control, PC = positive control. Western blot images shown are cropped to show the proteins of interest. The western blots were derived under the same experimental conditions; the original full-length western blot images are shown in Supplementary Fig. S4.

