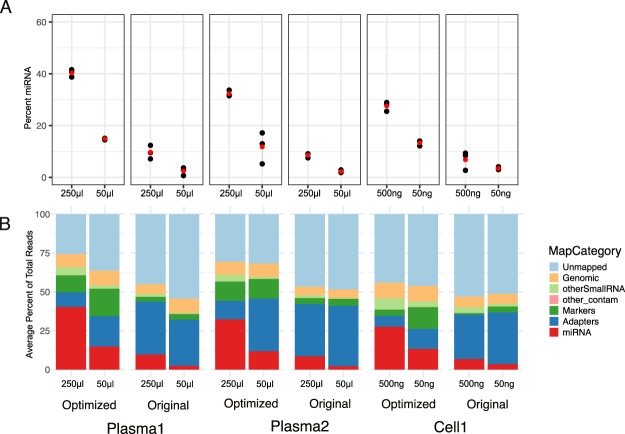
Figure 2.
Improved miRNA capture also seen at low concentrations of input RNA. (A) The percentage of reads mapping to miRNAs at the indicated input following either the optimized (0.05 μΜ 3′ adapter, 0.33 μΜ amino-modified 5′adapter) or the original (0.85 μM 3′ adapter, 3.3 μM unmodified 5′ adapter) protocol. Black dots represent the three replicates from each input RNA for each sample, protocol, and concentration. Red dots represent average. (B) The average percentage of reads mapping to different RNA classes for each sample, protocol, and concentration.

