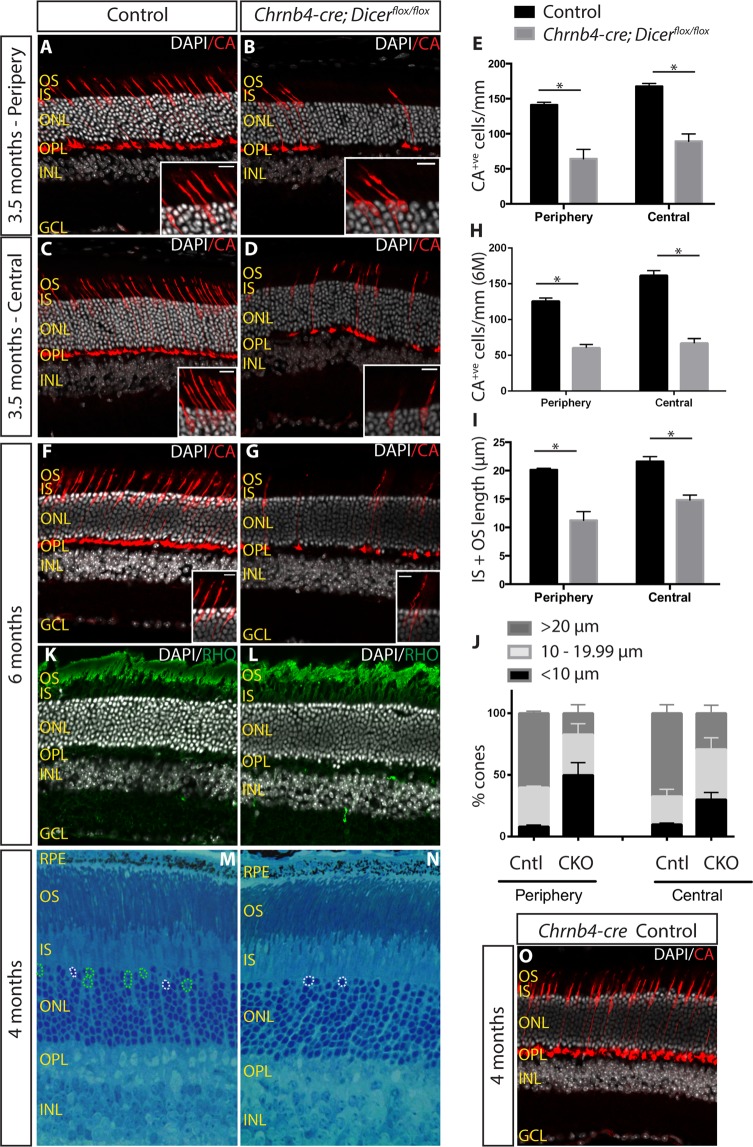
Figure 5.
Progressive cone photoreceptor degeneration. (A–D) Immunostaining with CA of 3.5 month old control (A,C) and Dicer CKO (B,D) peripheral and central retinas. (E) Quantification of CA+ve cone photoreceptors in 3.5 month old retinas. (F–G) Immunostaining for CA of 6 month old control (F) and Dicer CKO (G) retinas. (H) Quantification of CA+ve cone photoreceptors in 6 month old retinas. (I) Average length of CA+ve segments (IS + OS) in 3.5 month old retinas. (J) Graph showing the percentage of cones displaying long (>20 μm), medium (10–19.99 μm) and short segments (<10 μm) in control and Dicer CKO peripheral and central 3.5 month old retinas. (M,N) Toluidine blue staining of 4 month old control and Dicer CKO retinas. Green dashed circle indicate cone nuclei. White dashed circles indicate rod nuclei. (O) CA staining on Chrnb4-cre 4 month old retinas. OS: outer segments. IS: inner segments. ONL: outer nuclear layer. INL: inner nuclear layer. OPL: outer plexiform layer. GCL: ganglion cell layer. CA: cone arrestin. *Indicates p-value < 0.05. Mann-Whitney non parametric test was used. Error bars indicate standard error of the mean. Scale bar: 30 μm. Scale bar of insets: 10 μm.

