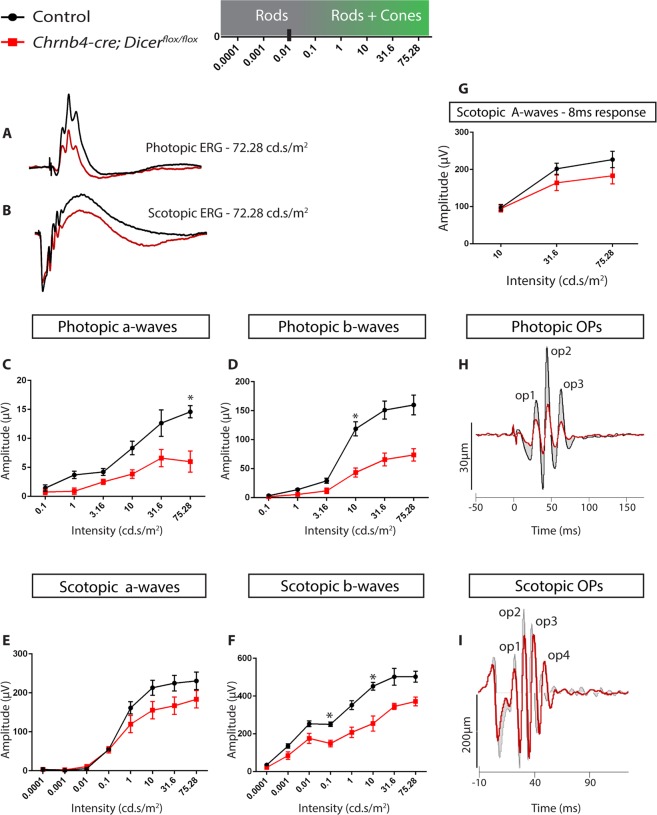
Figure 6.
Impaired retinal function in Dicer CKO. (A) Photopic waveforms of 4 month old control (black) and Dicer CKO (red) retinas at 72.25 cd.s/m2. (B) Scotopic waveforms of 4 month old control (black) and Dicer CKO (red) retinas at 72.25 cd.s/m2. (C,D) Light adapted photopic a- and b-wave amplitudes plotted at different light intensities for both control and Dicer CKO retinas. (E,F) Dark adapted scotopic a- and b-wave amplitudes plotted at different light intensities for both control and Dicer CKO retinas. (G) Scotopic 8 ms a-wave amplitudes for control and Dicer CKO retinas. (H) Fourrier analysis of photopic OPs at 72.25 cd.s/m2. (I) Fourrier analysis of scotopic OPs at 72.25 cd.s/m2. Cd: candela. OPs: Oscillatory potentials. Multiple T-test was performed. Sidak-Bonferroni was applied to correct for multiple testing. Adjusted p-value < 0.05 (*) was considered as significant. Error bars indicate standard error of the mean.

