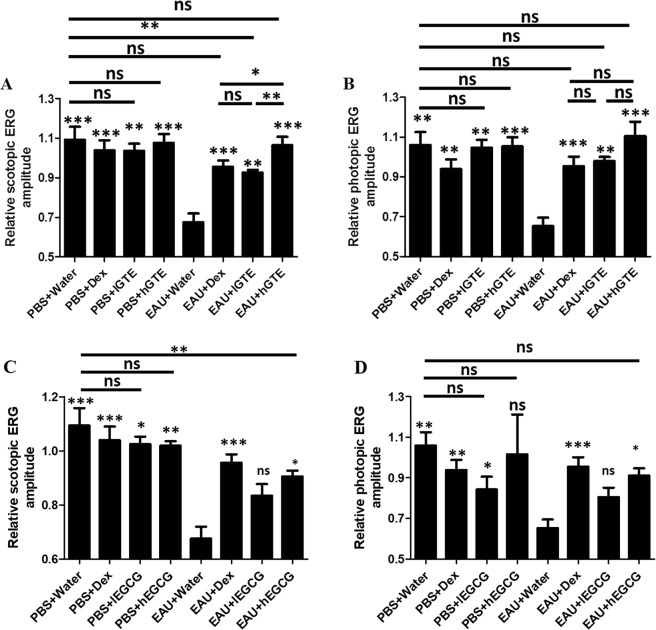
Figure 4.
Inter-group comparisons of scotopic (A,C) and photopic (B,D) ERG amplitudes. Relative ERG amplitude was calculated as amplitude at d21pi divided by that at baseline. The asterisk marked above each bar represents the statistical significance of comparison between EAU + Water group and the corresponding group. Data are also presented as mean ± SEM and analyzed by Mann–Whitney U test (*P < 0.05, **P < 0.01, ***P < 0.001, ns = no significance).

