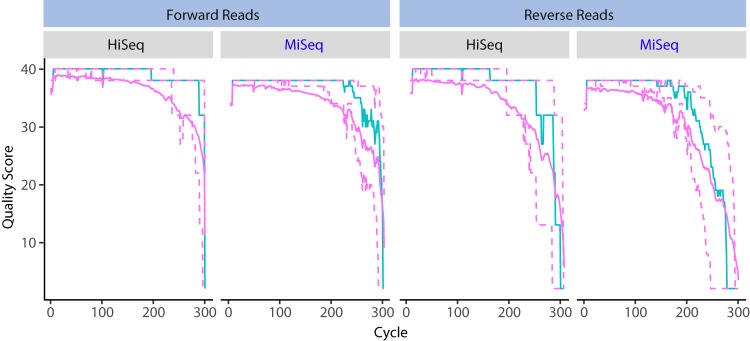
FIG 3.
Forward and reverse read quality profiles for 300 cycles on the Illumina HiSeq (1,536 samples) and MiSeq (444 samples) platforms. Amplicon libraries were prepared using a 2-step PCR method. Shown for each cycle are the mean quality score (green line), the median quality score (solid purple line), and the quartiles of the quality score distribution (dotted purple lines).

