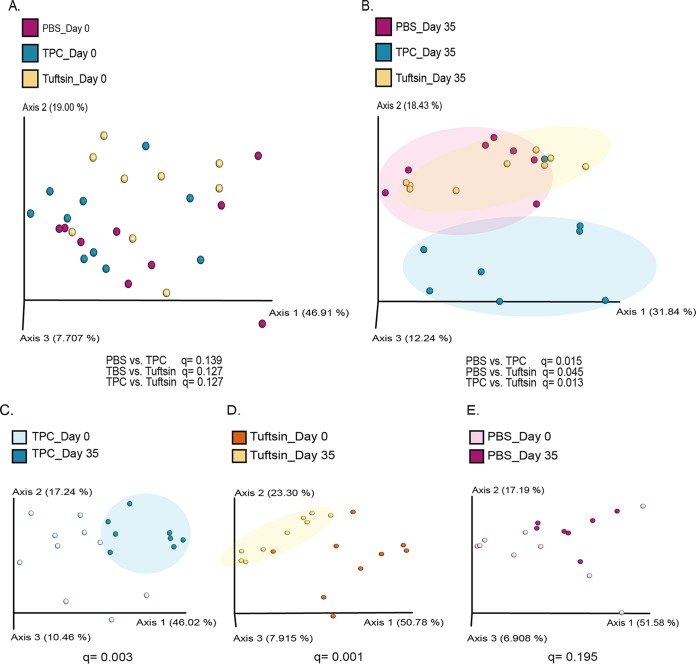
FIG 3.
Microbial communities of the differently treated mice with lupus cluster separately after treatment. Samples were clustered using a PCoA of weighted UniFrac distance matrix (N = 7 to 10/group) at day 0 (A), day 35 (B), day 0 versus 35 of TPC-treated mice (C), day 0 versus day 35 in tuftsin-treated mice (D), and day 0 versus day 35 in PBS-treated mice (E).

