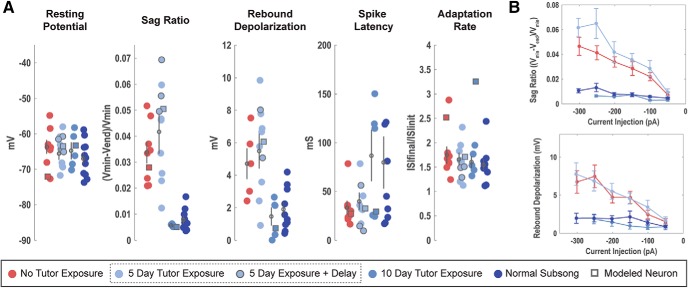
Figure 11.
Changes in HVCX neurons as a function of variable tutor exposure: A, Each scatterplot depicts a physiological feature of interest where each point represents measurement from a single neuron. The means and SEMs are plotted over each dataset. For the 5 d exposure data, features measured from birds tutored 5 d (30–35 dph) and then isolated for 5 d (35–40 dph) are plotted separately as outlined dots and were not entered into the plotted mean and SEM. The remaining circles are features measured from birds immediately after 5 d (35–40 dph) of tutor exposure. B, Mean (±SEM) for sag ratio and rebound depolarization across a range of current injection amplitudes.

