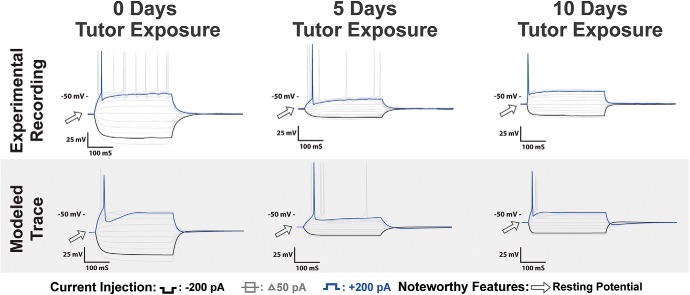
Figure 12.
HVCRA recordings as a function of variable tutor exposure: Top, Voltage traces of HVCRA neurons recorded with 0, 5, and 10 d of tutor exposure before recording. Features that changed as a consequence of increased tutor exposure included an increased Vrest and decreased spike amplitude. Bottom, Simulations of biophysical models calibrated to the experimental traces with current pulses of ±200 pA. The models predict that tutor exposure results in several parameter changes, as discussed in the Results.

