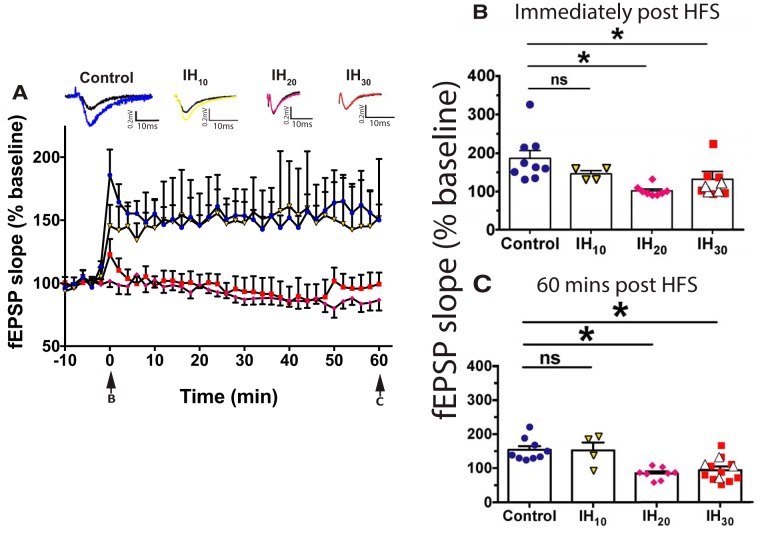
Figure 1.
Prolonged IH exposure attenuates LTP within the dentate gyrus. A, LTP of the fEPSP following HFS in control (blue circles; n = 9 slices, 7 animals), IH10 (yellow triangles; n = 4 slices, 2 animals), IH20 (magenta diamonds; n = 8 slices, 3 animals), and IH30 (red squares; n = 10 slices, 7 animals) illustrate differences in potentiation following HFS. Representative traces of evoked fEPSPs are shown above the graph with baseline (black trace) and post-HFS induction indicated (color traces: control, blue; IH10, yellow; IH20, magenta; IH30, red). Arrows at the bottom indicate the time sampled for B and C. Calibration: 0.2 mV, 10 ms. B, Immediately following HFS, a difference among groups was observed (F(3,27) = 6.667, p = 0.0016). A post hoc Dunnett's test revealed no difference immediately following HFS between control and IH10 groups, yet did in both IH20 and IH30 groups in the fEPSP slope when compared with control. C, Sixty minutes post-HFS, a difference among groups was detected (F(3,27) = 9.529, p = 0.0002). Post hoc Dunnett's test revealed that, while no difference was present between the control and IH10 groups, the fEPSP in both the IH20 and IH30 groups was reduced compared with control group. In a subset of experiments (n = 4 slices, 3 animals), applying to a larger stimulation current during HFS did not to evoke LTP in the IH30 group (B and C, white triangles). *p < 0.05.

