Figure 8.
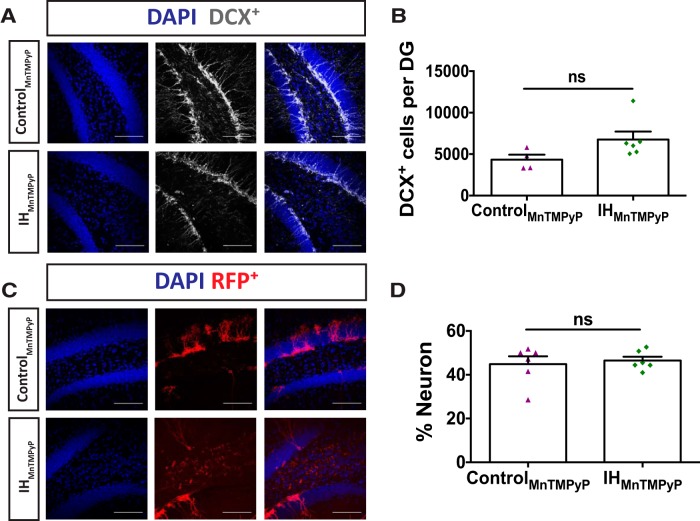
MnTMPyP administration reveals that neuron development is ROS dependent. A, Representative images of DCX+ labeling in controlMnTMPyP (top) and IHMnTMPyP (bottom) animals are shown. Blue channel depicts DAPI-labeled nuclei on left, gray channel depicts DCX+ labeling in middle, and a merge is on the right. Scale bars, 100 μm. B, Immature granule neurons labeled with DCX+ showed no significant difference between IHMnTMPyP and controlMnTMPyP groups (controlMnTMPyP, n = 4; IHMnTMPyP, n = 6; t(7.708) = 2.144, p = 0.066). C, Representative images of RFP+ labeling in controlMnTMPyP (top) and IHMnTMPyP (bottom) animals. Blue channel depicts DAPI-labeled nuclei on left, red channel depicts RFP+ labeling in middle, and a merge is on the right. Scale bars, 100 μm. D, The percentages of RFP+ neurons were not different between IHMnTMPyP and controlMnTMPyP groups (controlMnTMPyP, n = 6; IHMnTMPyP, n = 6; t(7.361) = 0.402, p = 0.699).

