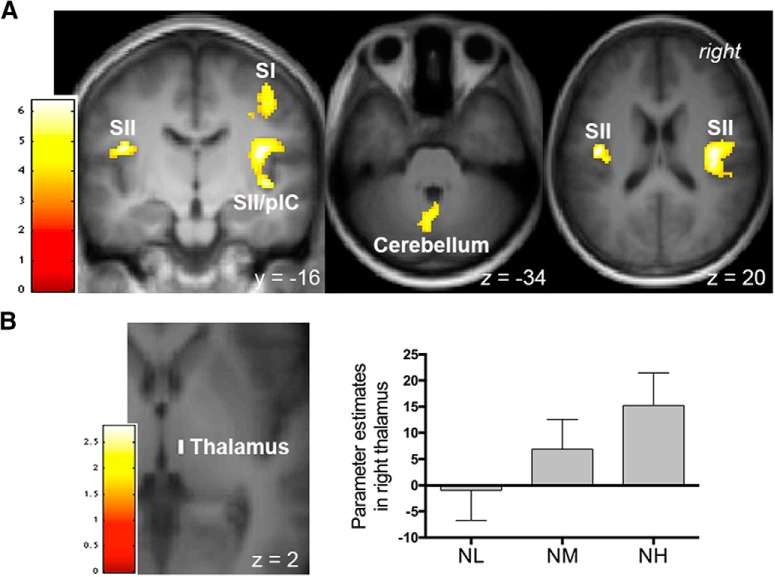
Figure 2.
Brain regions reflecting intensity coding of pain. Activations were identified from the contrast “NL < NM < NH.” A, A whole-brain analysis revealed significant activations in the right primary somatosensory cortex (SI), bilateral SII, right posterior insular cortex (pIC), and cerebellum. B, Activation within the right thalamus survived small-volume corrections (p < 0.05, FWE corrected). Bar graphs depict parameter estimates extracted from the suprathreshold cluster. Error bars represent SEM. A, B, Activations were overlapped on an average structural image. The bar on the left shows the range of t scores for SPM 8.

