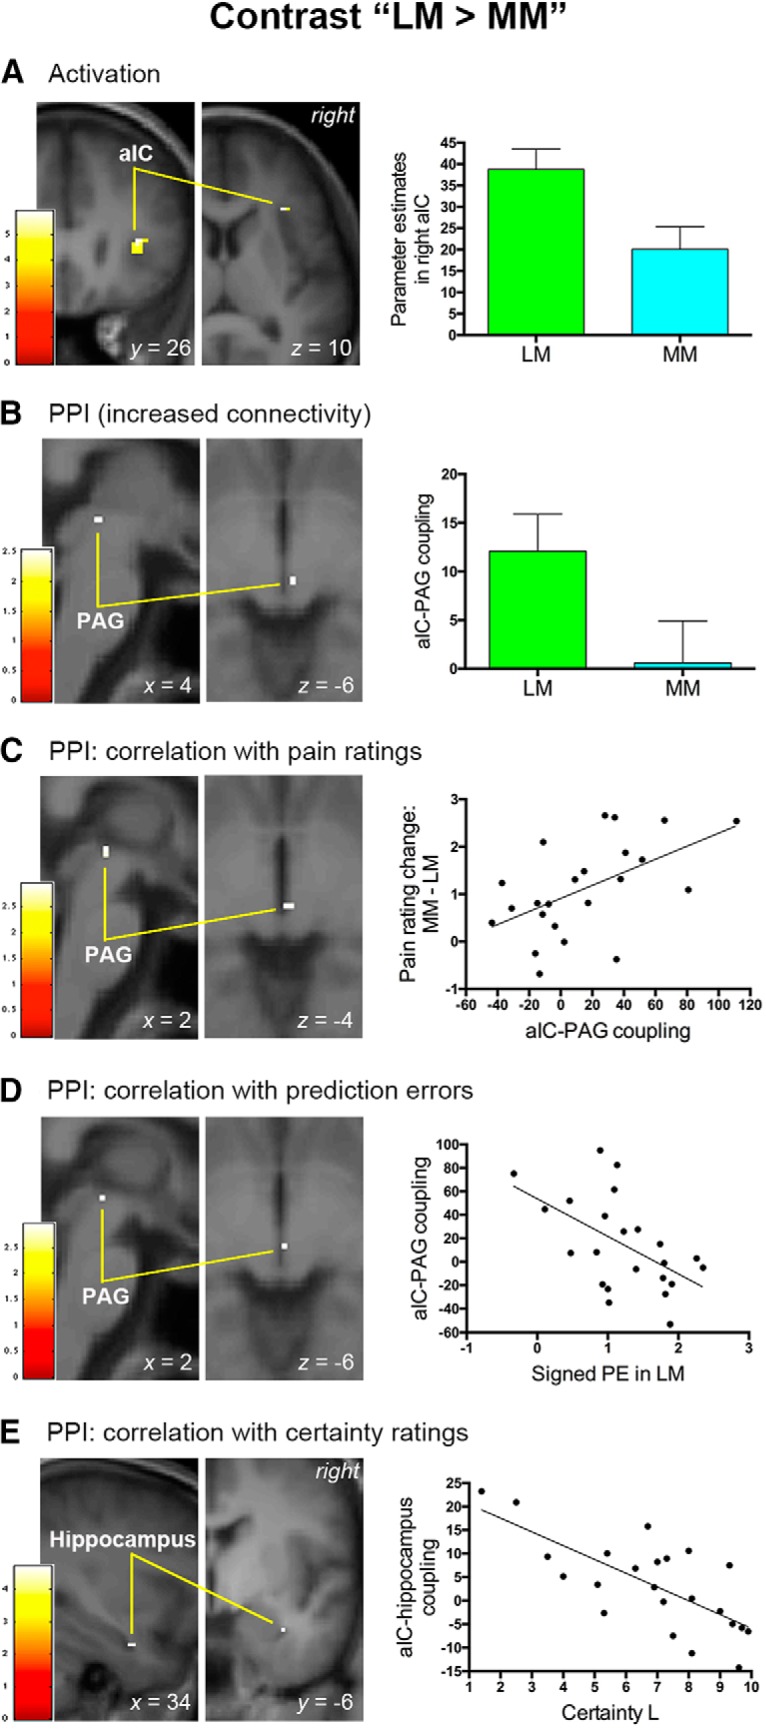
Figure 3.

Neural mechanisms associated with positive expectancy effects on pain. This figure shows the results of brain activation and PPI analyses in the right aIC associated with positive expectancy effects on pain. A, The right aIC exhibited increased activation as positive expectations reduced subjective pain perception. B, Positive expectations were also accompanied by an increase in functional connectivity between the right aIC and PAG. C, Functional connectivity between the right aIC and PAG predicted the magnitude of pain rating changes caused by positive expectations. D, The signed prediction error (PE) of pain engendered in the LM condition was inversely associated with the aIC–PAG connectivity associated with positive expectations. E, Functional connectivity between the right aIC and right hippocampus was inversely correlated with subjective certainty ratings elicited by a low-pain cue. A–E, Activation clusters survived small-volume corrections (p < 0.05, FWE corrected) and were overlapped on an average structural image. The bar on the left shows the range of t scores for SPM 8. Bar graphs and scatter plots depict parameter estimates extracted from the suprathreshold cluster. Error bars in A and B represent SEM. Scatter plots depict the relationship between behavioral data and the strength of functional connectivity.
