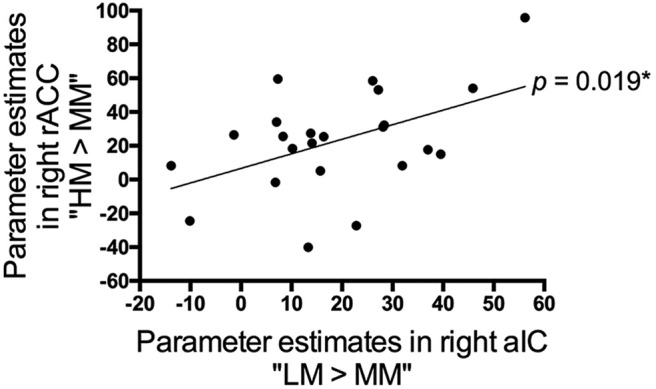
Figure 5.

Linear relationship between positive expectation- and negative expectation-associated brain activations. The BOLD signal within the significant cluster in the right aIC (contrast “LM > MM”) increased monotonically with that in the right rACC (contrast “HM > MM”) across subjects (p = 0.019). Data in this scatter plot were parameter estimates extracted from the suprathreshold cluster of the contrast “LM > MM” (Fig. 3A) and “HM > MM” (Fig. 4A). *p < 0.05.
