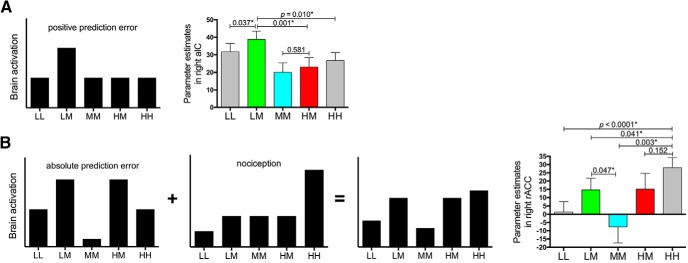
Figure 6.
Response patterns in key regions underlying stimulus expectancy effects on pain. Black bars depict theoretical pattern of BOLD signals across different trial types (equal weighting of both components in B). A, The right aIC possibly engendered a positive prediction error of pain because its response during the LM condition was significantly stronger than all the rest four conditions and there was no significant difference between the HM and MM conditions. B, The response profile of the right rACC could be accounted for by an absolute pain prediction error component (highest responses in LM and HM, lowest in MM, with LL and HH in the middle) plus a nociception component (highest for high-pain stimulation, followed in descending order by middle- and low-pain stimulation). For the aIC and rACC, the BOLD signals were extracted from the suprathreshold cluster of the contrast “LM > MM” (Fig. 3A) and “HM > MM” (Fig. 4A), respectively. *p < 0.05.

