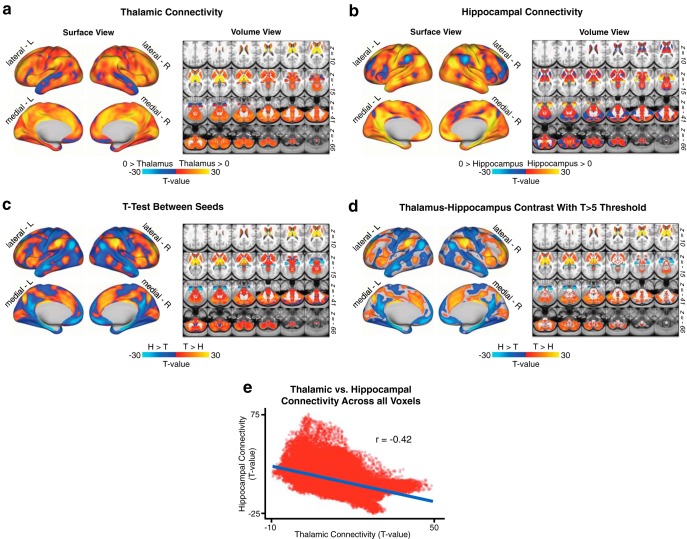
Figure 1.
Hippocampal versus thalamic seed connectivity. N = 339 healthy adults (HCP dataset). Comparison of thalamic and hippocampal resting-state functional connectivity in the HCP dataset. a, Surface and volume maps showing the connectivity profile of the thalamus as a t test against zero in the n = 339 healthy subjects. b, Same as in a, showing hippocampal functional connectivity. c, Threshold-free dependent-samples t test between thalamic and hippocampal functional connectivity in the HCP sample. d, The same contrast, masked at a threshold of T > 5 for illustrative purposes. e, Scatterplot of the voxelwise relationship between thalamic and hippocampal scores from a and b, showing the anticorrelation between whole-brain thalamic and hippocampal functional connectivity in a normative sample of healthy adults (Pearson r = −0.42, p < 2.2 × 10⁻⁶).

