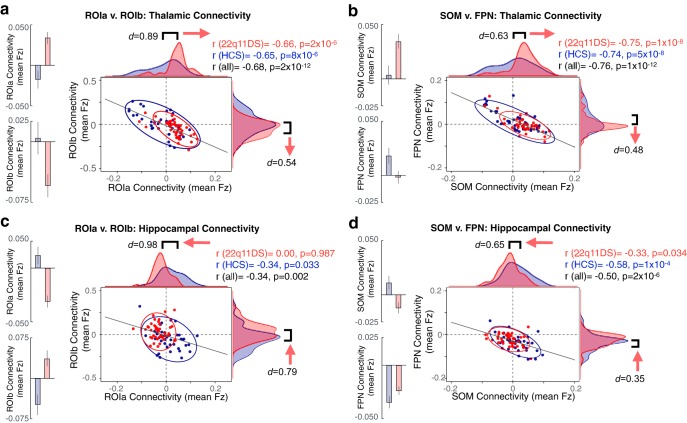
Figure 11.
Distinct effects across thalamic and hippocampal seeds. Expanding on Figure 10, showing distributions and relationships across subjects for whole thalamic and hippocampal seeds individually. The thalamic effect shifts in the opposite direction to the hippocampal effect. a, Thalamic seed-based connectivity to the ROIs derived from the whole-brain interaction analysis (i.e., ROIa and ROIb as shown in Fig. 2). Red represents 22q11DS distributions. Blue represents HCs. b, Thalamic connectivity to SOM and FPN a priori derived functional networks (Yeo et al., 2011). c, Hippocampal connectivity to ROIa and ROIb. d, Hippocampal connectivity to SOM and FPN networks. For considerations regarding Type I error protection, see original Figure 2 and Figure 9 analyses.

