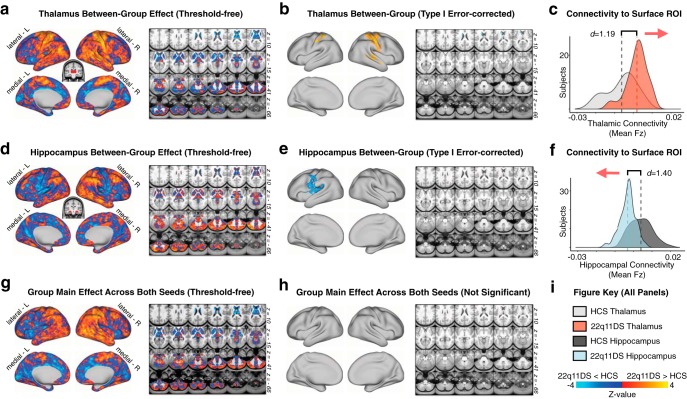
Figure 3.
Separate seed-based connectivity maps. Group contrasts for functional connectivity of separate thalamic and hippocampal seeds. a, Surface and volume maps showing the threshold-free effect (22q11DS vs HCs) for the thalamic seed. Yellow-orange contrast represents 22q11DS > HCs. Blue represents HCs > 22q11DS. b, Same contrast as in a, restricted to regions remaining significant after Type I error protection (applying the same nonparametric permutations methods as in Fig. 2). c, Distributions of group mean thalamic connectivity to the yellow-orange surface ROI in b. d–f, Same as in a–c, showing the main effect of Group for the hippocampal seed. g, Threshold-free main effect of Group (i.e., regions that exhibit a consistent pattern of alterations regardless of seed) is shown for completeness and visual inspection. h, No main effects of Group survived Type I error correction. i, Color key for brain maps and distribution plots.

