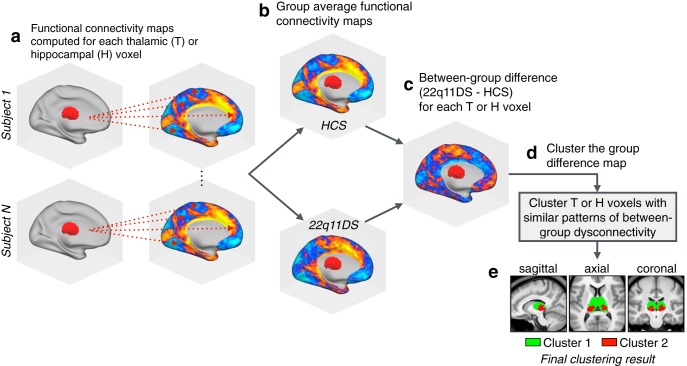
Figure 4.
Clustering algorithm flow-chart. A graphical illustration of the procedure for k-means clustering of thalamic voxels. This same procedure was repeated for the hippocampal k-means analyses, as well as both hierarchical clustering models. a, First, functional connectivity was computed at the single-subject level for each voxel in the thalamus or hippocampus (with regards to all other voxels in the brain). b, The resulting single-subject connectivity maps were then averaged within the HCS and 22q11DS groups (separately for thalamus and hippocampus connectivity). c, For each seed, a single between-group difference map was computed between the HCS and 22q11DS group average connectivity maps. d, The group-difference maps generated in c serve as the input for the clustering algorithms (k-means and hierarchical clustering). e, Example clustering result showing a k-means (k = 2) solution for the thalamus (see Figure 5).

