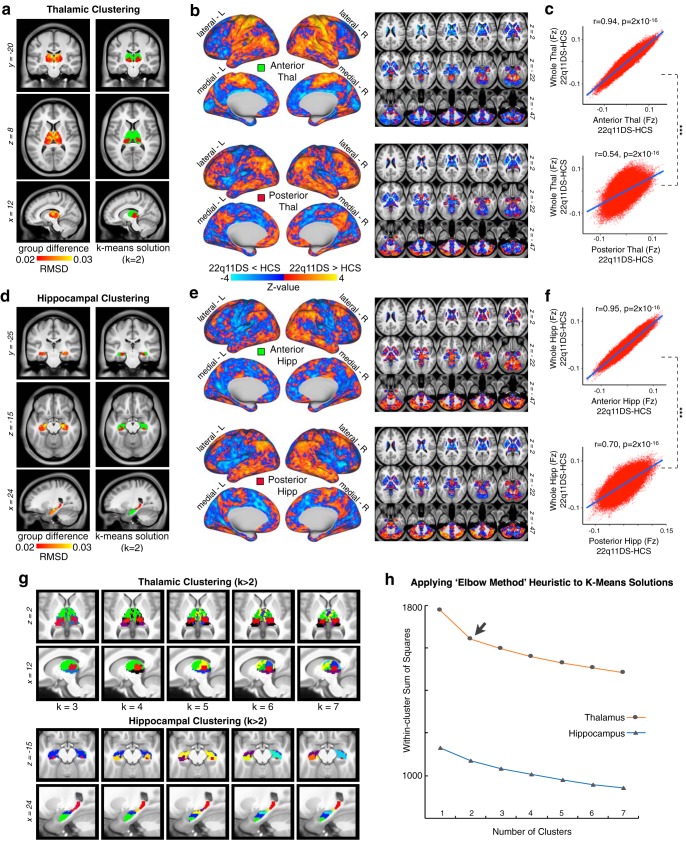
Figure 5.
Data-driven clustering of thalamic and hippocampal voxels. k-means clustering of thalamus and hippocampus by group. a, Left, Group difference map (root mean square) for the thalamus, highlighting the anterior and medial dorsal nuclei. Right. The k = 2 solution splits the thalamus into an anterior and posterior cluster. b, Surface and volume maps show the group difference (22q11DS vs HCs) for the brainwide functional connectivity of the anterior thalamic cluster (top) and posterior cluster (bottom). Yellow-orange contrast represents 22q11DS > HCs. Blue represents HCs > 22q11DS. c, Voxelwise relationship between the brainwide functional connectivity maps for each thalamic cluster versus the whole-thalamus seed (see Fig. 3). The correlation with the whole-seed effect is significantly larger for the anterior cluster (top) compared with the posterior cluster (bottom) (Steiger's z = 263, p = 2 × 10⁻¹⁶). d–f, Replication of a–c for the hippocampus, showing a similar anterior–posterior distinction (z = 240, p = 2 × 10⁻¹⁶). g, Distinct k-means solutions ranging from k = 2 to k = 7 always reveal an anterior solution (green). h, Elbow plot illustrating percent variance explained by each progressive cluster solution.

