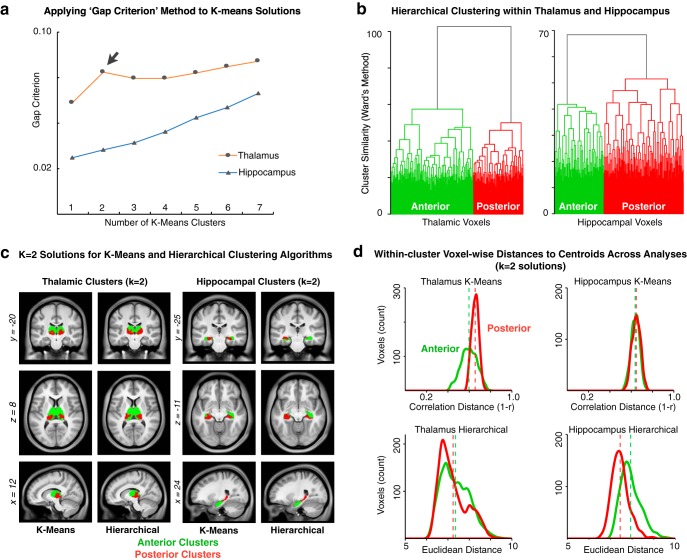
Figure 6.
Additional clustering analyses. a, The “Gap Criterion,” as described by Tibshirani et al. (2001), formally tests the within-cluster error terms for each k-means solution compared with an appropriately generated null reference distribution (for details, see Materials and Methods). b, Hierarchical clustering approach for the thalamus and hippocampus, using the method of Ward (1963), is with full dendrograms that converge into well-separated anterior and posterior groups for both structures (i.e., k = 2). c, Side-by-side presentation of the k = 2 solutions derived via k-means and hierarchical clustering in both seeds, highlighting the overall similarity between results. d, For each thalamic and hippocampal k-means and hierarchical k = 2 solutions, distributions are plotted for the distances between cluster centroids and each voxel assigned to that cluster. Green represents anterior clusters. Red represents posterior clusters. Vertical dashed lines indicate the average within-cluster distance-to-centroid for each cluster.

