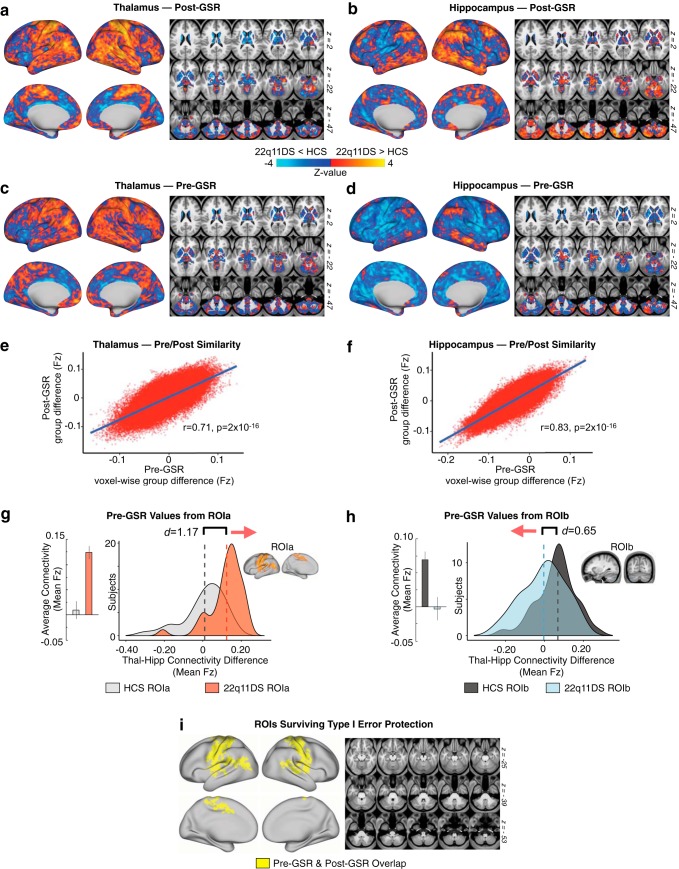
Figure 8.
Stability of effects before and after GSR. Here we show a comparison of functional connectivity effects computed with and without GSR as a preprocessing step. a, b, Post-GSR threshold-free connectivity for thalamus and hippocampus (same as Fig. 3). c, d, Thalamic and hippocampal connectivity before GSR. e, f, Pearson correlation between pre- and post-GSR matrices. g, h, Pre-GSR data extracted from ROIa and ROIb (see Fig. 2). i, Overlapping regions (logical AND) for Type I error-corrected interaction effect pre-GSR and post-GSR (for a detailed list of all regions found to exhibit a significant Group × Seed effect pre-GSR, but not post-GSR, see Figure 8-1). The cerebellar effect observed in the original analysis (see Fig. 2 ROIb) was not found to be significant in the case where GSR was not applied, but the distributions presented here in h show a qualitatively similar (though weaker) functional connectivity effect for that ROI without GSR.

