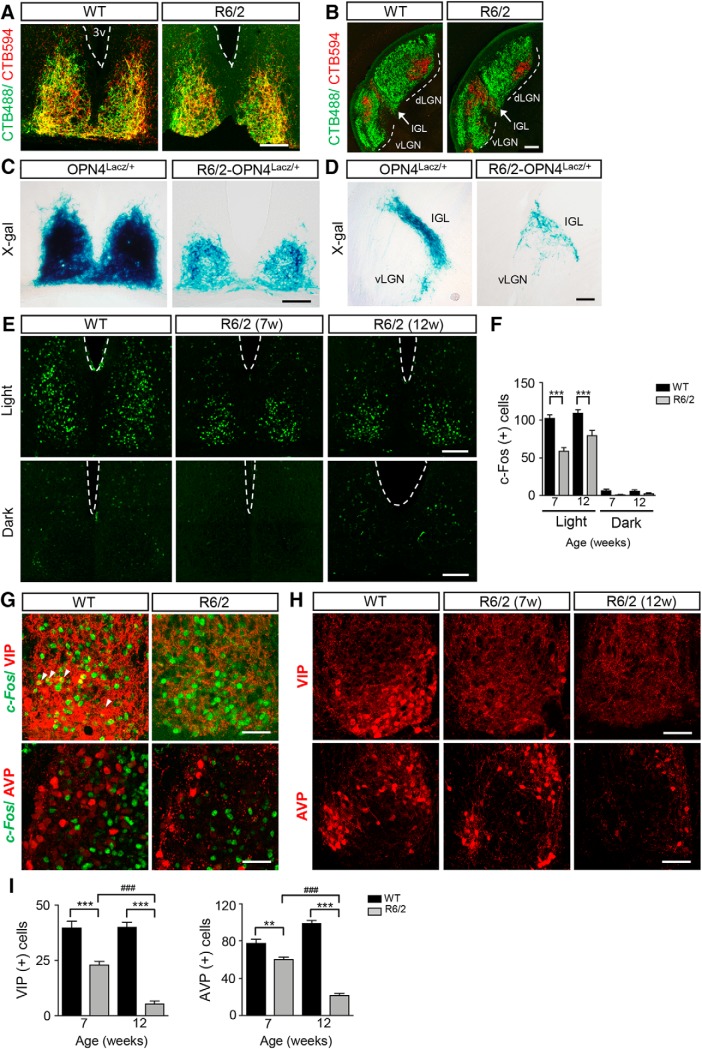
Figure 7.
Synergistic decrease of retinal input and VIP- and AVP-positive neurons in the R6/2 SCN. A, B, Confocal images showing no differences in the double CTb-labeled RGC innervation of the SCN (A) or IGL and LGN (B) between R6/2 mice and control mice at the age of 12 weeks (n = 5–6 for the indicated mice). C, D, Representative images showing the X-gal-labeled M1-ipRGC innervation in the SCN (C) and IGL and ventral LGN (D) of R6/2-OPN4Lacz/+ or OPN4Lacz/+ mice at the age of 12 weeks (n = 3–4 for the indicated mice). E, Representative images of light- induced c-Fos expression in the SCN after mice (n = 3–5 for the indicated mice) received 15 min of light exposure (500 lux) at ZT16, detected by anti-c-Fos antibodies. The c-Fos expression in the SCN in the absence of light stimulation at ZT16 is shown as an experimental control (n = 3 for the indicated mice). F, Numbers of c-Fos positive neurons under light stimulation or no light conditions in the indicated mice of different ages are presented. G, Confocal images showing that light-induced c-Fos was partially detected in VIP-immunoreactive neurons (arrowheads) in control mice (12 weeks), which was not seen in AVP-immunoreactive neurons. Note that c-Fos/VIP-immunoreactive neurons were reduced in R6/2 mice relative to control mice at the age of 12 weeks (n = 5 for each group). H, Changes in VIP(+) neurons and AVP(+) neurons in SCN from mice at 7 and 12 weeks of ages. I, Numbers of VIP(+) and AVP(+) neurons in the indicated mice during disease progression (n = 3–6 for each group). Scale bars: A–E, 100 μm; G, 25 μm; H, 50 μm. **p < 0.01, ***p < 0.001, ###p < 0.001, two-way ANOVA.

