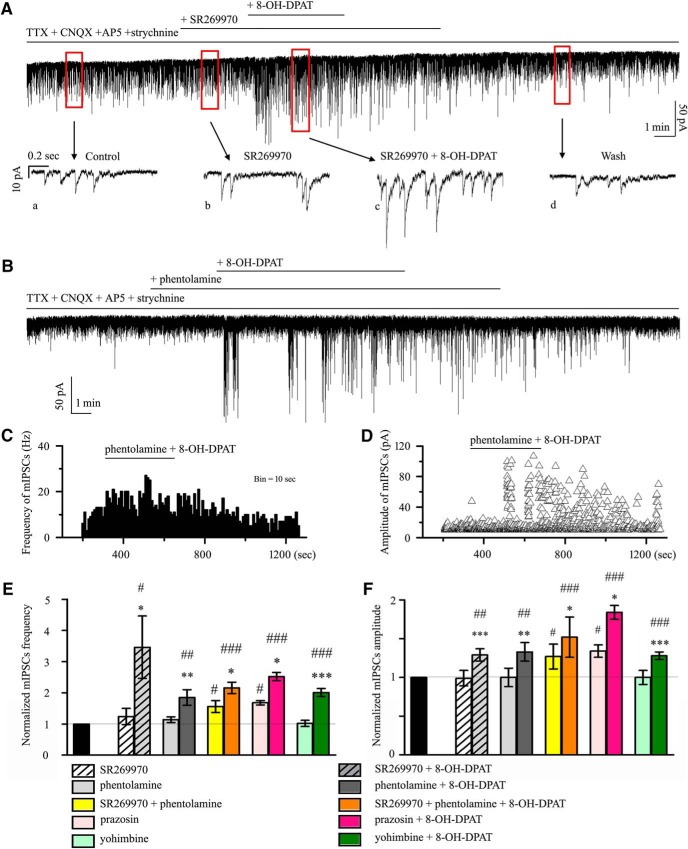
Figure 12.
5-HT7 receptor or α-adrenoceptor antagonists did not block the effects of 8-OH-DPAT at the synaptic level. A, SR269970 failed to block the incremental effects of 8-OH-DPAT on mIPSC frequency and amplitude. Vertical bar, 50 pA; horizontal bar, 1 min. Sample traces show the effects of 10 μm SR269970 applied alone (b) or along with 10 μm 8-OH-DPAT (c) and drug washout (d) on GABAAR-mediated mIPSCs. SR269970 itself did not affect baseline mIPSC amplitude or frequency. Vertical bar, 10 pA; horizontal bar, 0.2 s. B, mIPSCs before and during the application of 8-OH-DPAT (10 μm) in the presence of phentolamine (10 μm). Note that adding 8-OH-DPAT in the presence of phentolamine dramatically increased mIPSC frequency and amplitude. Vertical bar, 50 pA; horizontal bar, 1 min. C, Time–frequency histograms from an RGC tested with 8-OH-DPAT (10 μm) in the presence of phentolamine. D, Time–amplitude histograms from an RGC tested with 8-OH-DPAT (10 μm) in the presence of phentolamine. E, F, Mean percentage control of mIPSC frequency (E) and amplitude (F) obtained during SR269970 (n = 12), phentolamine (n = 10), SR269970 + phentolamine (n = 14), prazosin (n = 12), and yohimbine (n = 12) application with (right side of each group) or without (left side of each group) 8-OH-DPAT. Note that the application of SR95531 + phentolamine and prazosin alone increased the normalized frequency and amplitude of mIPSCs (*p < 0.05, **p < 0.01 and ***p < 0.001 vs each antagonist group. #p < 0.05, ##p < 0.01 and ###p < 0.001 vs control).

