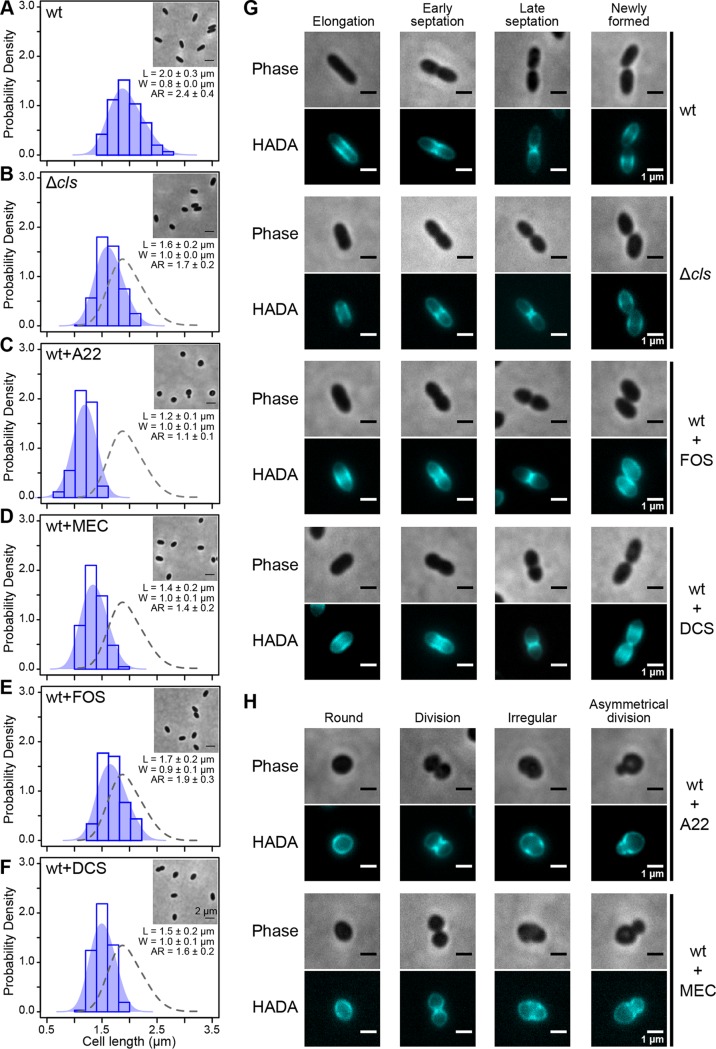
FIG 2.
CL participates in cell shape determination by affecting lipid II biosynthesis. (A to F) Probability density histogram of the cell length distribution of R. sphaeroides wt cells (A), Δcls cells (B), wt cells treated with A22 (C), wt cells treated with mecillinam (MEC) (D), wt cells treated with fosfomycin (FOS) (E), and wt cells treated with d-cycloserine (DCS) (F). Cells were grown in plain Sistrom’s minimal medium or Sistrom’s succinate medium containing the indicated small-molecule inhibitors until log phase (absorbance of 0.6, λ = 600 nm) and imaged by phase-contrast bright-field microscopy. Scale bar, 2 μm. Each data point represents a mean value ± standard deviation of the cell length (L), width (W), and aspect ratio (AR) for 300 cells determined by ImageJ. The shaded blue area overlaying the histogram represents the Kernel density estimation (KDE) of the cell length distribution. We overlaid a gray dashed line outlining the KDE of the cell length distribution of R. sphaeroides wt cells with the other five histograms for comparison. (G) Representative micrographs of HADA-labeled R. sphaeroides wt cells, Δcls cells, wt cells treated with FOS, and wt cells treated with DCS. (H) Representative micrographs of HADA-labeled R. sphaeroides wt cells treated with A22 and wt cells treated with MEC. Cells were grown in plain medium or medium containing the indicated small-molecule inhibitors to early log phase (absorbance of 0.3, λ = 600 nm), labeled with HADA, and imaged using phase-contrast bright-field and fluorescence microscopy. We used sub-MICs of the following inhibitors: A22 (10 μg/ml), MEC (0.5 μg/ml), FOS (250 μg/ml), and DCS (0.05 μg/ml).

