FIG 4.
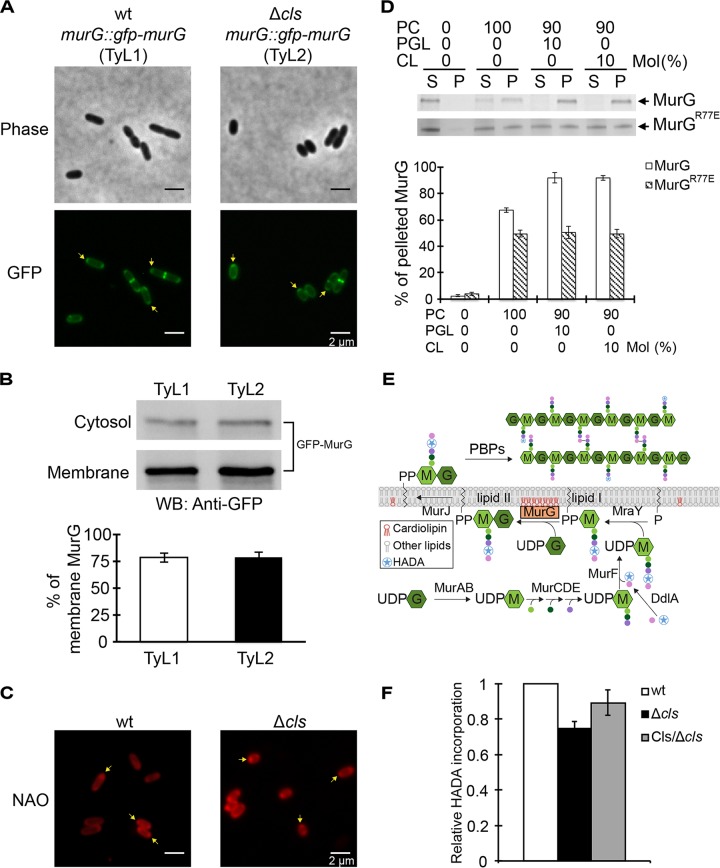
R. sphaeroides MurG interacts with CL, and the interaction is important for its enzymatic activity and cell elongation. (A) Representative micrographs of TyL1 and TyL2 cells, which are R. sphaeroides wt and Δcls cells in which the genomic murG was replaced with gfp-murG, respectively. Cells were grown to log phase (absorbance of 0.6, λ = 600 nm) and imaged using phase-contrast bright-field and fluorescence microscopy. Arrows indicate the pole-localized MurG. (B) Biochemical fractionation of TyL1 and TyL2 cells. We fractionated TyL1 and TyL2 cell lysates that had the same amount of proteins into cytosolic and membrane fractions and performed Western blot (WB) analysis using a monoclonal antibody against GFP. The percentage of membrane-localized MurG was determined by quantifying the optical densitometry signal using ImageJ. Data represent mean values ± standard deviations obtained from three independent experiments. (C) Representative micrographs of R. sphaeroides wt and Δcls cells stained with NAO. Cells were grown to early log phase (absorbance of 0.3, λ = 600 nm), stained with NAO, and imaged using fluorescence microscopy. Arrows indicate the polar enrichment of NAO. (D) Liposome-pelleting assays of MurG and MurGR77E with liposomes containing the indicated phospholipids. The percentage of pelleted MurG was determined by quantifying the optical densitometry signal using ImageJ. Data represent mean values ± standard deviations obtained from three independent experiments. S, supernatant; P, pellet. (E) A diagram depicting the incorporation of HADA into the lipid II molecule by MurG and its assembly into the existing PG by PBP proteins. We hypothesize that CL interacts with MurG and is important for its activity. As CL does not affect PG assembly, we assessed the effect of CL on lipid II production by quantifying the incorporation of HADA into the existing PG. (F) Quantification of HADA incorporation in R. sphaeroides wt cells, Δcls cells, and Δcls cells expressing Cls. Cells were grown until early log phase (absorbance of 0.3, λ = 600 nm) and labeled with HADA. We measured the fluorescence emission of HADA and normalized the fluorescent signals by determination of CFU. Each data point (mean value ± standard deviation) was obtained from three independent experiments.

