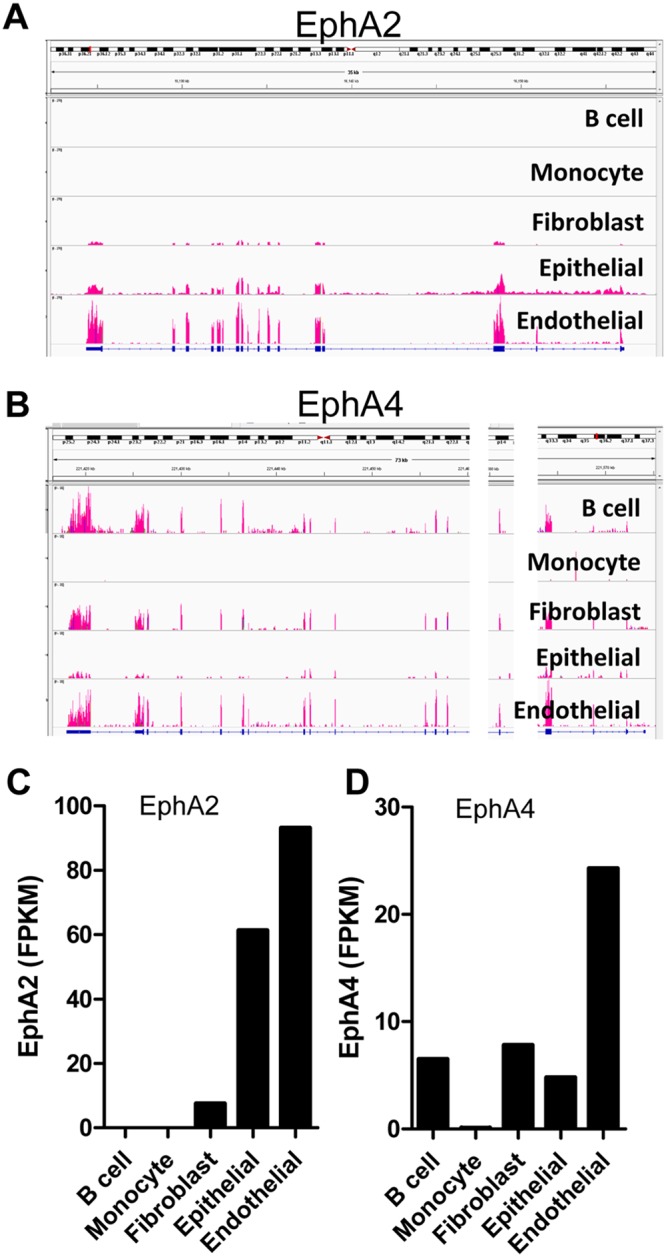
FIG 2.

EphA2 and EphA4 expression in KSHV target cells. (A and B) The distribution of EphA2 (A) and EphA4 (B) sequencing reads across EphA2 or EphA4 exons. BAM-formatted files were generated by alignment of RNA-seq data from various cell types infected by KSHV. RNA-seq data were obtained from the Sequence Read Archive database (NIH), and aligned data were then loaded into the Integrative Genomics Viewer (Broad Institute) to acquire the transcript map, with exon reads shown in red. Two chromosomal regions, in which no reads for EphA4 were detected, were removed and are shown as white bars, allowing the transcript map to fit within the figure. (C and D) The mean fragments per kilobase of transcript per million mapped reads (FPKM) of EphA2 (C) and EphA4 (D) in various KSHV target cells. FPKM was determined using the Cuffdiff software (Broad Institute).
