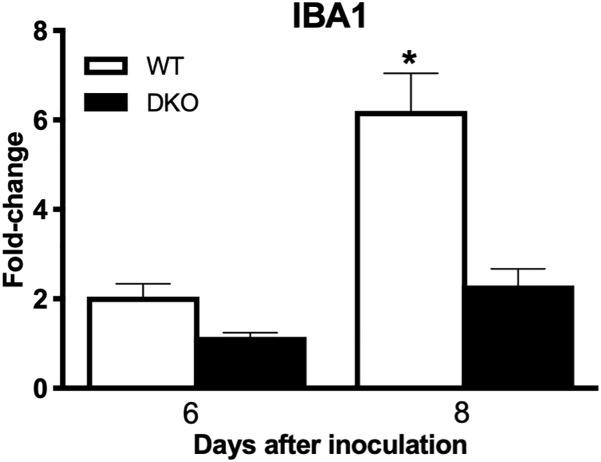
FIGURE 7.
IBA1 expression levels in the brains of WT and DKO mice. qRT-PCR was conducted to determine the fold change in IBA1 gene expression. Change in the levels of IBA1 was first normalized to the β-actin gene and then the fold-change in infected brains was calculated in comparison to corresponding mock-infected brains. Data represents the mean ± SEM, representing two independent experiments. ∗p < 0.05.

