
Figure 2.
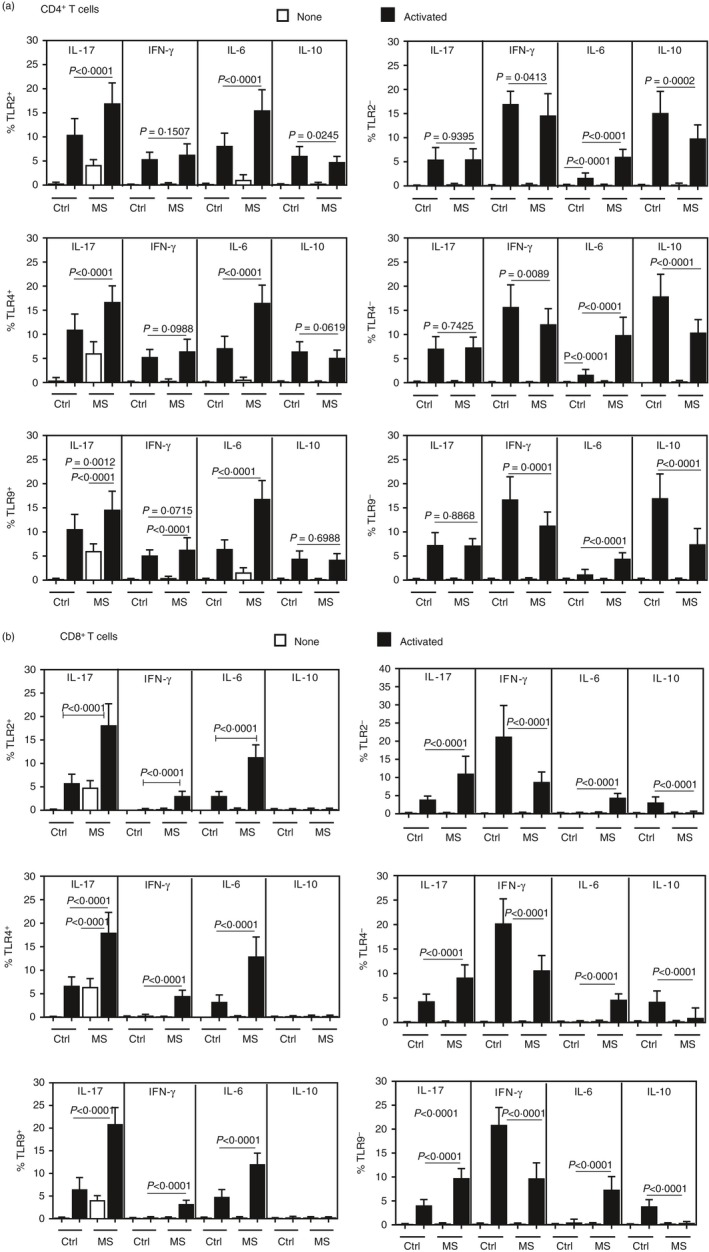
The cytokine profile of Toll‐like receptor (TLR)+ T‐cells in MS patients. The percentage [± standard deviation (SD)] of CD4+ (a) and CD8+ (b) T‐cells positive for TLR‐2, ‐4 and ‐9 able to produce interleukin (IL)‐17, interferon (IFN)‐γ, IL‐6 or IL‐10 was determined before and after activating T‐cells (1 × 10⁶/ml) from control individuals (n = 20) and multiple sclerosis (MS) patients (n = 30). The cells were activated with anti‐CD3/anti‐CD28 (5 μl/ml), for 3 days. The P‐values were obtained by the Mann–Whitney U‐test. Representative histograms showing identification of IL‐17, IFN‐γ, IL‐6 or IL‐10 production by TLR+ CD4+ (Supporting information, Fig. S1) and TLR+ CD8+ (Supporting information, Fig. S2) T‐cells from both groups, after acquisition of 200 000 events, are shown in the supplementary figures.