Figure 6.

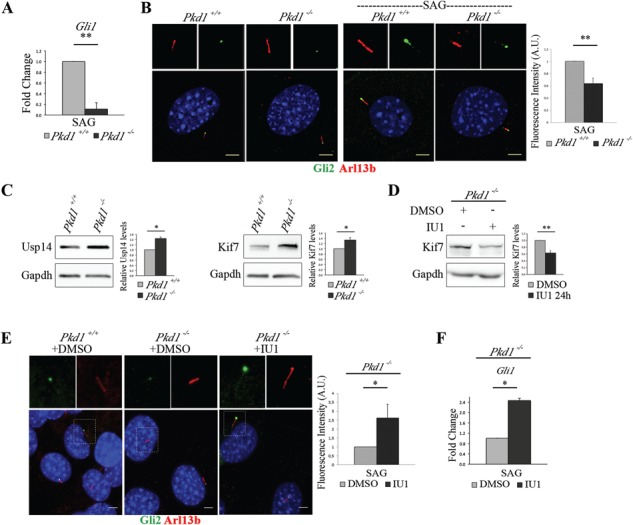
Usp14 inhibition rescues Gli2 ciliary localization in Pkd1 mutant MEFs. (A) mRNA expression levels of Gli1 in Pkd1+/+ and Pkd1−/− MEFs under 24 h of SAG stimulus expressed as fold change after normalization with the Hprt mRNA. (B) Immunofluorescence staining of endogenous Gli2 (green) and Arl13 (red) on unstimulated Pkd1+/+and Pkd1−/– MEFs (left panel), and on Pkd1+/+ and Pkd1−/− MEFs stimulated with SAG for 24 h (right panel). Hoechst labels nuclei (blue). Histogram shows the quantification of Gli2 relative fluorescence intensity on cilia in Pkd1+/+ and Pkd1−/− MEFs under SAG treatment. (C) Usp14, Kif7 and Gapdh were detected by WB analysis. Band intensities for Usp14 and Kif7 versus Gapdh were normalized and the relative quantification was represented in histograms as fold change. (D) WB analysis of Kif7 protein levels in Pkd1−/− MEFs treated with IU1 for 24 h. Histogram on the right shows quantification of the relative band intensities for Kif7 normalized versus Gapdh. (E) Immunofluorescence staining of endogenous Gli2 (green) and Arl13 (red) on Pkd1+/+ (DMSO, left panel), Pkd1−/− (DMSO, central panel) and Pkd1−/− treated with IU1 for 24 h (right panel). Hoechst labels nuclei (blue). Histogram shows the quantification of Gli2 relative fluorescence intensity on cilia of Pkd1−/− MEFs treated with IU1 and controls. Each sample was under SAG stimulus for 24 h. (F) qRT-PCR analysis revealed mRNA expression levels of Gli1 under SAG treatment for 24 h in IU1 or DMSO-treated Pkd1−/− MEFs. Data are expressed as mean ± SEM (n = 3 independent experiments); one-tailed Student’s t-test *P < 0.05; **P < 0.01. ≥100 cells were analyzed per sample. Scale bar = 5 μm. SAG = Smoothened agonist.
